
Spring came early in 2014 judging by lengthy time series


That‘s easy to forget, considering the inconsistent and rainy summer that followed. But spring 2014 was unusually warm, and there was more sunshine and less rain than in previous years. This impression is also confirmed by the measurements of the German Weather Service (Deutsche Wetterdienst, DWD). But not only the weather was rosy, spring vegetation also appeared earlier than normal. Cherries, coltsfoot, dandelions and wood anemone blossomed some two weeks in advance of the long-standing average (source: Meteoswiss).
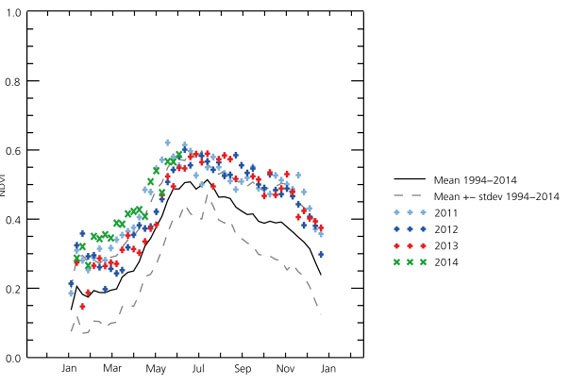
The springtime “greening” of nature can also be seen in satellite image time series. With the help of a vegetation index — for example the NDVI (Normalized Difference Vegetation Index) – the annual advance of vegetation can be monitored, compared and analysed based on many years of optical satellite data. NDVI is a measure of vegetation density: the greener the landscape, the higher the NDVI values. AVHRR satellite data have been acquired at EOC for the past 20 years at 1.1 km resolution (nadir) and used to routinely calculate daily NDVI values, which are archived. Figure 1 shows mean NDVI values as recorded by the AVHRR instrument for Europe over the course of a year. The solid black line is the 20-year average, the coloured crosses show the values for the years 2011 to 2014. From the beginning, 2014 was characterized by high values. The increase in January and February can be attributed to a lack of snow, but March and April, to name just these two months, continue the trend with values considerably higher than in previous years.
Another interesting feature of this graph is the clearly increased values for all the years from 2011 to 2014 compared with the 20-year average. Although the data were corrected for the differences in spectral sensitivity of the various AVHRR sensors, there is a clear trend toward higher NDVI values, with regional variations. Other science teams have independently identified the same phenomenon, which is being further researched. To what extent the high NDVI values in 2014 were caused by the early start of spring in that year and to what extent they are part of the long-standing trend is also a matter of current research. Also worth investigating are questions like the effects on these curves of the continuous shift in the time of recording due to the orbit drift of each sensor, changes in measured reflectance values caused by the ensuing differences in the angle of incoming and reflected solar radiation (BRDF, bidirectional reflectance distribution function), cloud distribution, and sensor degradation that remains uncorrected in cases where on-board calibration is not possible.
In order to make possible these and other in-depth analyses DFD has initiated the TIMELINE project, which has the goal of reprocessing the entire DFD AVHRR raw data archive, a collection gathered over the past 30 years, to generate value-added products. NDVI is only one of many time-series products to be included in the five categories “satellite observation”, “surface radiation variables”, “land surface”, “cryosphere” and “atmosphere”. Information on TIMELINE can be found at www.timeline.dlr.de.
The high NDVI values in 2014 prompt a look at the large-scale atmospheric circulation pattern. At middle geographic latitudes so-called planetary waves decisively characterize the flow patterns of air masses on continental and global scales. These patterns are a direct consequence of the earth’s rotation and are governed by the net effect of Coriolis and pressure gradient forces.
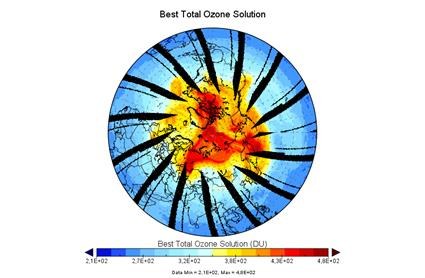
DFD identifies daily the activity of these planetary waves using satellite-based measurements of ozone column concentration. This value represents the amount of ozone gas contained in a virtual pillar which has a ground area of one square meter and extends upward from the earth’s surface to the end of the atmosphere. The stratospheric ozone which comprises most of the ozone column has a relatively long life. It can therefore be used somewhat like a contrast medium to reveal flow patterns in the atmosphere. Figure 2 shows areas with relatively high ozone column concentrations forming three maxima alone one parallel of latitude (a so-called “wave 3 structure”).
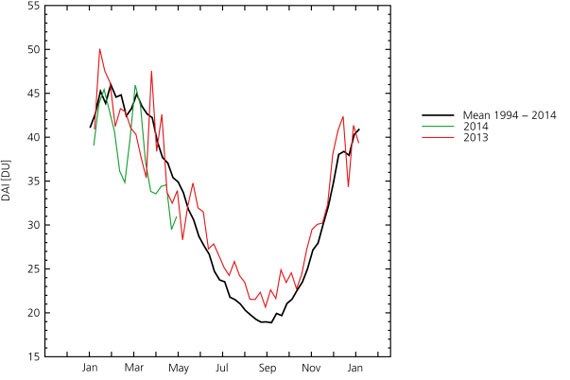
The Dynamic Activity Index (DAI) developed at DFD is a simple index describing the mid-zonal activity of a planetary wave. It is calculated for a latitude range from 50°N (to reduce the influence of polar chemical ozone destruction on the DAI) to the equator (Fig. 3). A spectral breakdown for zonal waves 1 to 5 yields the wave amplitudes for each; these are then averaged for all latitudes.
The annual cycle resulting from adding up all DAI for zonal waves 1 to 4 (see Fig. 3) shows low activity in summer and high in winter, which corresponds to expectations. Planetary waves spread out from the troposphere into the stratosphere first and foremost when the wind comes from the west (that is, mainly during the winter). The general trend of the curve for spring 2014 (green) is somewhat below the 20-year mean (black curve), which is also the case for spring 2013 (red curve). This means that on average the meridional transport of air masses in these years was below average.
So-called stratospheric warming leads to some of the most dramatic changes in atmospheric circulation. Sudden increases in planetary wave activity are involved. The phenomena can be generated by resonant wave-wave interaction between stationary and moving parts of planetary waves. If the increase is too large the wave field becomes unstable and the wave breaks – analogous to a water wave approaching the shore. The strong collapse in wave activity visible in the graph (for example in December 2013 or February 2014) is an indication of such stratospheric warming. Evidently there was especially strong stratospheric warming in spring 2014 (green curve). The consequence of such warming is a displacement of the polar vortex away from the pole so that the global circulation increasingly directs cold air masses to North America while Europe receives air masses of rather moderate temperature by comparison. This effect may have contributed to the observed high temperatures in spring 2014, thereby influencing the NDVI values. But to precisely clarify the processes involved, further careful investigations are needed.
Against the background of global warming it can be expected that the temperature makeup — and thus also the meridional temperature gradient — will change. This would have immediate consequences for the activity of planetary waves and thus possibly also an indirect influence on the state of vegetation.