500 Terabyte (TB) compressed into one image – Big Data in Earth Observation
January 25, 2017
500 Terabyte (TB) compressed into one image – Big Data in Earth Observation
The European Sentinel-1, Sentinel-2 and Sentinel-3 missions will generate a daily data volume in excess of 20 TB by the end of 2017. In view of this large quantity, new processing procedures are called for, like those used by the TimeScan processor developed and successfully tested by EOC. The procedure distils a single information product from a multitude of satellite images acquired over a lengthy time period. Over 450,000 images collected by U.S. Landsat satellites from 2013 to 2015 were processed to produce the now published “TimeScan-Landsat 2015” product.
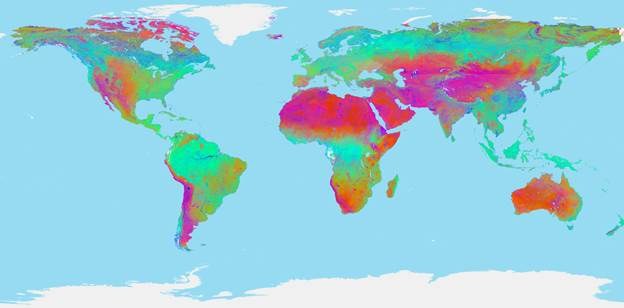
Figure 1: Global TimeScan Landsat 2015 data set
presented as a false colour composite of the mean temporal value of the settlement index (NDBI) in red, of the vegetation index (NDVI) in green and of the water index (NDWI) in blue.
Some 500 terabytes of separate images condensed to a 20th of their original size can be analysed in the form of a single, global, cloud-free image. This is not simply a satellite image mosaic. Instead, the information content of the multispectral images was condensed as statistical ranges covering the entire recording period and taking into account the various spectral channels. Analysis of the land surface is possible based on indices for such aspects as the state of vegetation, water cover, or human settlement (built-up areas). For each of the recorded parameters the minimal, maximal and mean values were determined for the entire period from 2013 to 2015.
The procedure is designed to help end users exploit information from masses of data that until now were too unwieldy for them to handle. The individual satellite images are no longer transferred to users, as formerly, but processed on large computer clusters, ideally where the data were first acquired. This eliminates distribution of immense quantities of data to numerous individual users, who no longer need to have their own computer infrastructure to analyse them. On the contrary, now only the analysed end product, whose size is only a fraction of the original amount of input data, is sent to the user.
To test the procedure, the TimeScan processor was transferred to the Super Computing Center IT4Innovations in Ostrava-Poruba, Czech Republic and used to calculate the so-far unique global TimeScan Landsat 2015 product (Figure 1). “Our global data set has a spatial resolution of 30 m per pixel. That means that we had to process—including all the intermediate products—over 1.5 petabytes of data”, reports Soner Üreyen, one of the participating scientists. “The Landsat mission has recorded over four million individual scenes over the last four decades, making it an ideal resource for testing the processing of mass data, like what the Sentinel programme will be supplying in the near future.
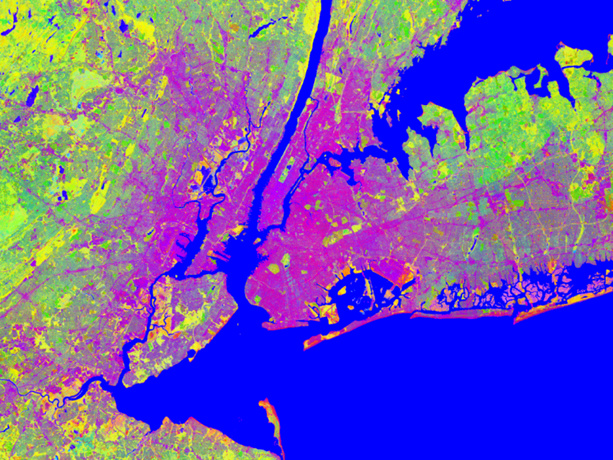
The TimeScan Landsat processor contains a module that uses an automated procedure to download the required Landsat scenes from different databases. A cloud mask is provided and, if desired, atmospheric correction can be undertaken for the scenes. The next step is to calculate selected spectral indices. “By taking into account all the validated initial values, such as the times without cloud cover, the spectral behaviour is determined for the selected time period and used to determine the actual land cover type”, explains EOC scientist Mattia Marconcini (see figure 2). “Compared with the mass of original input data, a much smaller volume of data has to be processed and analysed.”
The TimeScan Landsat 2015 product is available from the Urban Thematic Exploitation Platform (U-TEP) at https://urban-tep.eo.esa.int, which is coordinated by EOC. The product can be viewed using the U-TEP Geobrowser. U-TEP is one of six Earth Observation Exploitation platforms resulting from an initiative started in 2014 by ESA to develop new technologies for extracting information from earth observation data in anticipation of the European Sentinel missions.
According to project leader Thomas Esch the new data set is being used in the context of the U-TEP project to generate various settlement-related geoinformation products. “We can use it for the globally automated mapping of built-up areas with so far unequalled precision. For this purpose, we evaluate the data set together with a complementary product calculated on the basis of Sentinel-1 radar scenes. In addition, with its help we can derive worldwide settlement densities and the proportion of green spaces within built up areas.” In order to also include the temporal aspect of settlement development, EOC scientists are already working on creating global TimeScan Landsat data sets for earlier time periods (see figure 3).
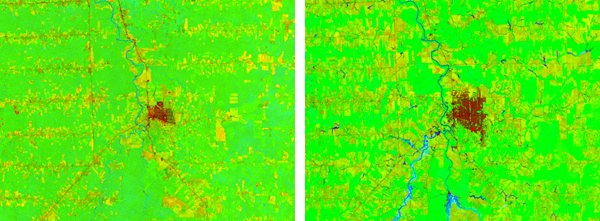
Figure 3: TimeScan Landsat product for the region around the city of Ariquemes, Brazil, derived for the years 1985 (left) and 2015 (right).
Comparison of the two false colour composites with the temporal maximum settlement index in red, the vegetation index in green and the temporal mean value for the water index in blue shows how built-up areas (red) and agricultural land (yellow and orange) extended far into the vegetation-rich surroundings in the course of the years.
This work is being undertaken to support scientists and decision makers in public planning and environmental offices and in development banks. It will also contribute to improved understanding of the worldwide phenomenon of urbanisation. The TimeScan data sets now available and those that will become available based on Sentinel data have great potential for a wide range of applications beyond the urban context. These include research questions related to land cover and land use mapping, agriculture, forestry, monitoring polar and coastal regions, risk management, disaster prevention and resource management.


