
Sahara Dust over Southern Germany

On 22 February 2016 skies in some locations of southern Germany had a cloudy yellow hue and vehicle windshields bore a fine, dusty deposit. The cause was desert sand brought by high-altitude winds from the Sahara to Europe. With the help of satellite data EOC scientists are monitoring the transport of Sahara dust and identifying its source.
They make use of a transport model that was configured as part of the VAO-AlpEnDAC (Virtual Alpine Observatory - Alpine Environmental Data Analysis Center) project so that the source of air masses and their loads can be determined on demand. Flextra, the trajectory model employed, was developed at the Norwegian Institute for Air Research (NILU). The calculations were initialised with the Global Forecast System (GFS), which provides meteorological model data on a 0.25° resolution grid (in central Europe equal to ca. 70 kilometres between grid points).
Most of the dust transported from the Sahara moves west, south and east, especially in summer and autumn. Passat winds then carry the dust in the West out over the Atlantic, and the dust in the South into the Sahel at the edge of the Intertropical Convergence Zone. In the East the Asian summer monsoon is primarily responsible for dust transport. However, in late winter and spring, the low pressure zones that often develop over the central and western Mediterranean have an influence that extends far into the central Sahara. This low pressure turbulence brings air masses from the Sahara to Europe, often giving rise to the hot desert wind over the central Mediterranean known as the Sirocco. Along with these air masses Sahara dust is transport to southern Germany, and sometimes even farther north.
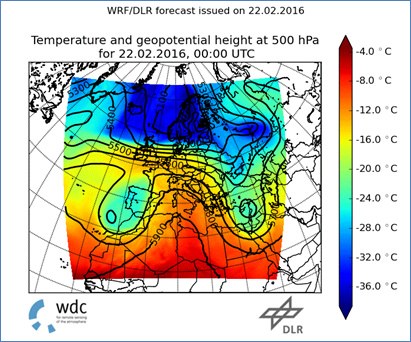
On 21 February a low pressure zone off the Moroccan coast caused dust to be carried first northwest, then on the 22nd also northeast toward the Alps and their foothills. The upper-air weather map for the 500 hPa air-pressure area (at ca. 5500 m altitude) shows this low-pressure zone. The black lines of constant pressure at that altitude can be roughly regarded as an approximation of flow lines. On the eastern side of the low-pressure zone the wind travels from south to north over Spain and France before turning east. The source of the air masses in the Munich area on 22 February was determined with the help of backward trajectory models.

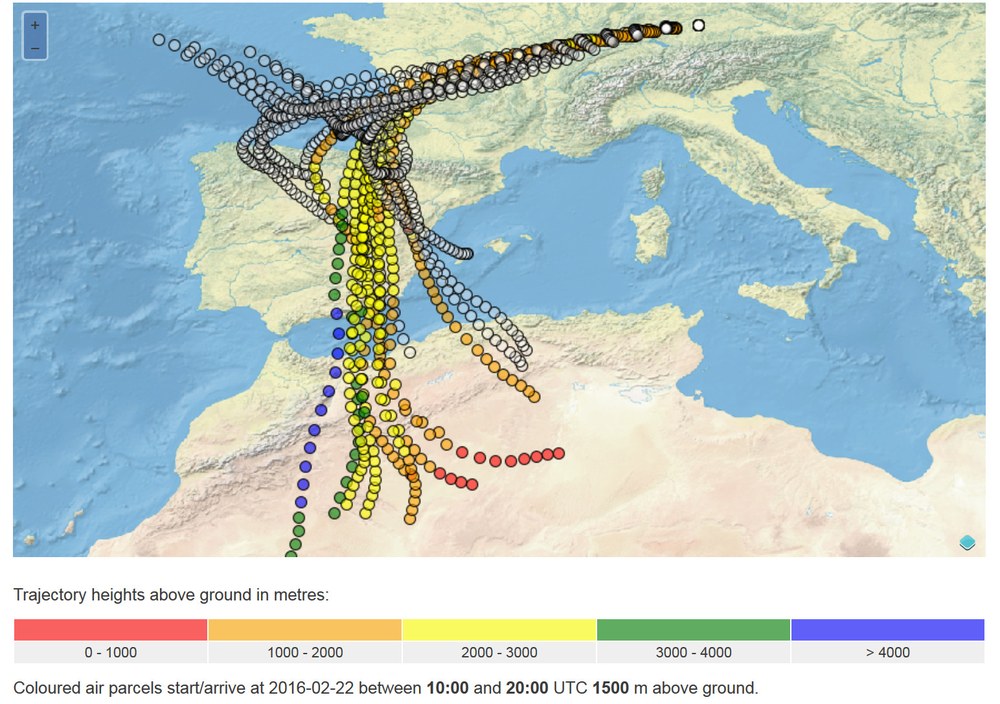
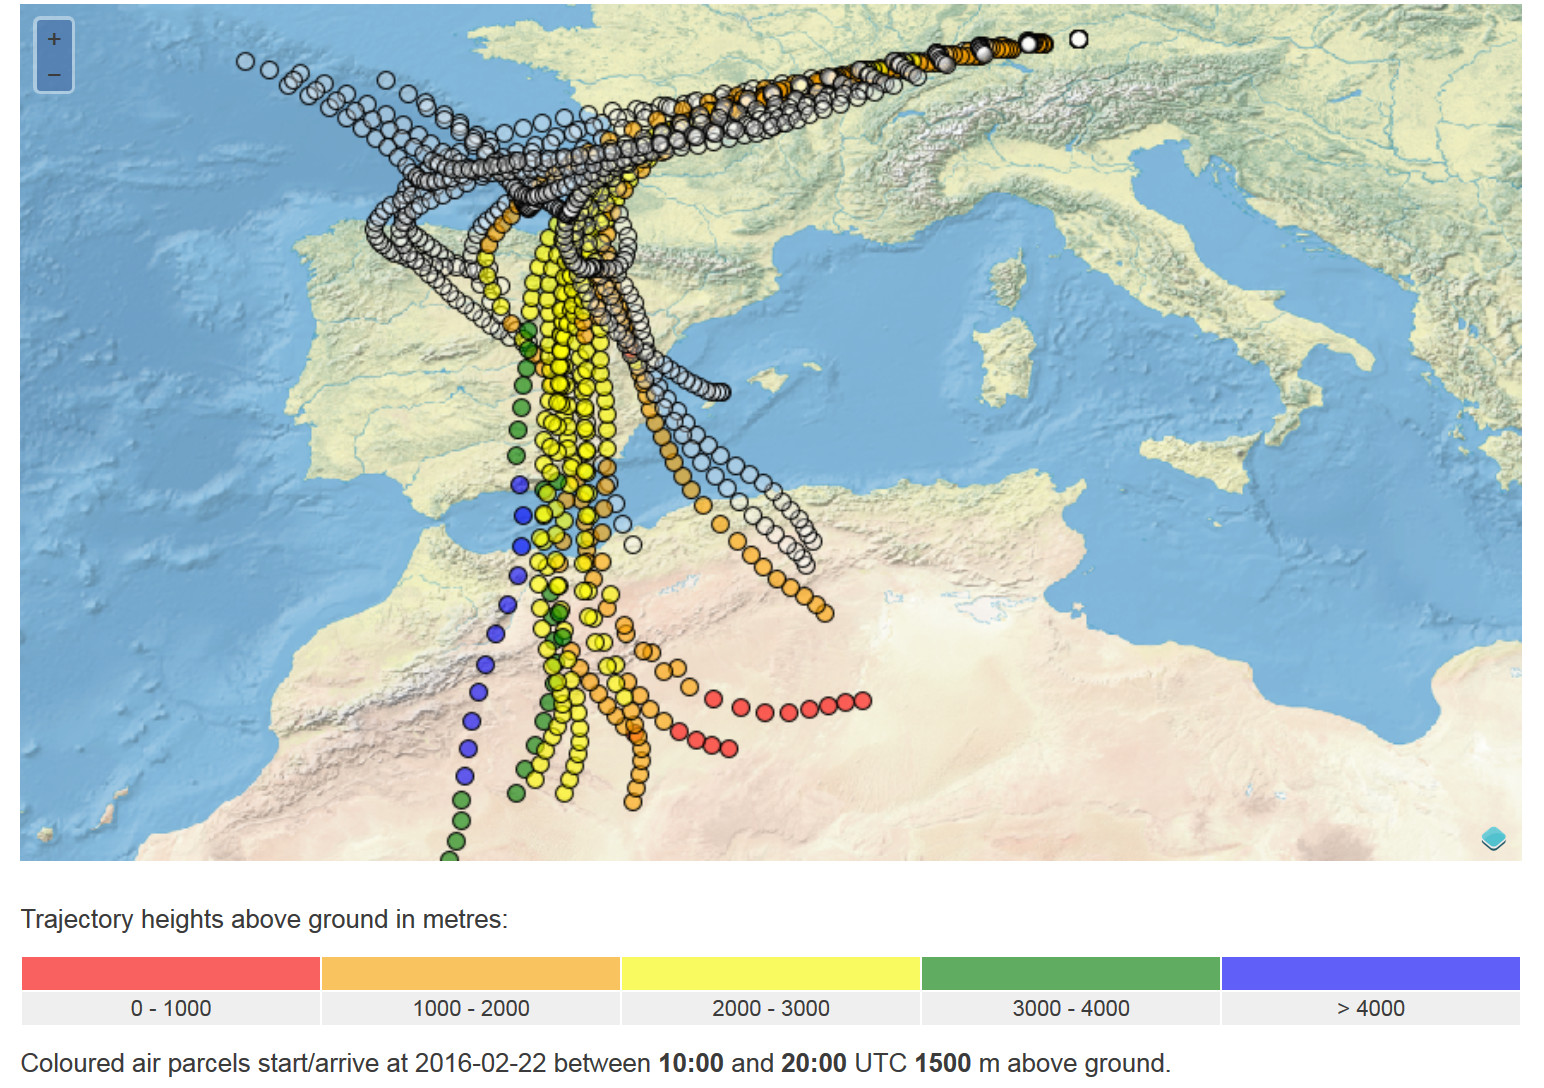
An analysis of the path of the air masses from the Sahara shows them arriving in southern Germany during the afternoon of 22 February. The altitude of the moving air packets is colour coded. The map shows that most of them come from an area south of the Atlas Mountains and that the arriving dust originated there.
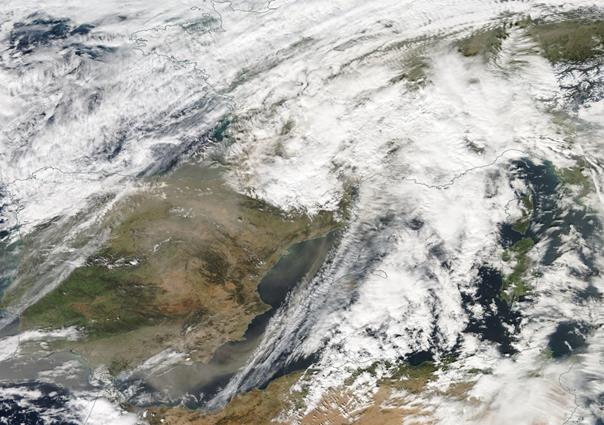
The path of the Sahara dust over the Iberian Peninsula and France can also be traced on an image based on data from the US satellite Suomi-NPP. This dust was transported to southern Germany at the front of a band of clouds extending from northwest Spain over France and Germany.
In addition to directly identifying dust loads in satellite data and modelling their point of origin, EOC scientists are also investigating the influence of dust in the atmosphere on solar-powered electricity generating facilities. Dust contributes to atmospheric haze, diminishing the intensity of solar radiance and significantly reducing the yield from solar energy plants.
The VAO-AlpEnDAC project is financed by the Bavarian State Ministry of the Environment and Consumer Protection (BayStMUV). In addition to EOC, the Leibniz Supercomputing Centre (LRZ), the institute of Physics at Augsburg University, and the Schneefernerhaus Environmental Research Station (UFS) participate in this project.