Ozone hole over the Arctic
Ozone data derived from satellite measurements are showing currently (middle of March 2020) a typical ozone hole feature in the polar Northern hemisphere (Arctic; Figure 1). What is called an ozone hole is, if the total amount of atmospheric ozone (total column ozone) is below a value of 220 Dobson Units. DLR Scientist Prof. Martin Dameris explains the mechanisms of atmospheric physics and chemistry that have led to the currently observed ozone hole over the Arctic, which is seen full scale for the first time. Usually such a feature has been observed in the polar Southern hemisphere (Antarctic) in spring, but not in the Arctic.

Today’s operating satellite instruments produce an exact picture of the Earth's atmosphere and its chemical composition. They monitor the development of the stratospheric ozone layer, which is important for life on Earth. An ozone hole can occur in polar regions if chemical and dynamic processes are interacting in a specific way.
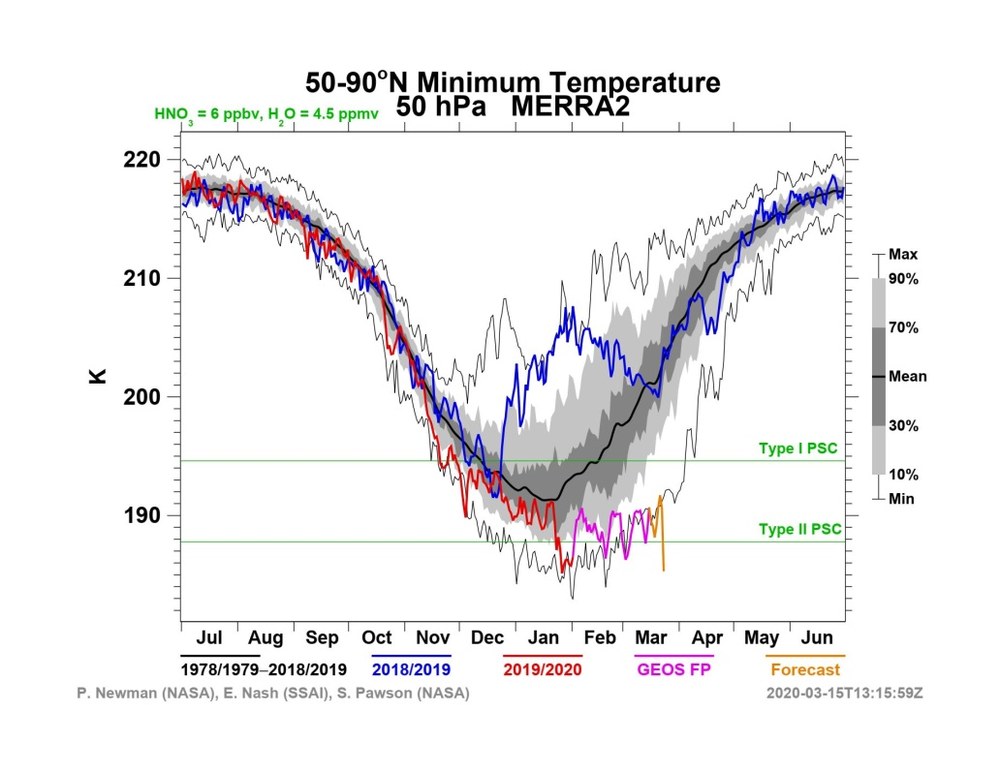
This year from early February to mid-March the polar winter wind vortex in the stratosphere was unusually stable and cold: There, at 30 km altitude a zonal wind speed of 50 m/s was measured (Figure 2: Zonal wind at 60°N, 10 hPa). Polar temperatures around 20 km altitude were below minus 80°C during polar night during this time period (Figure 3). Due to the darkness, the air masses considerably cooled down. This leads to the formation of polar stratospheric clouds (PSC), which is an important prerequisite for chemical ozone depletion in the stratosphere. When the sun rises in spring, sunlight delivers the energy required for starting a chemical depletion process of ozone. Stratospheric ozone is reduced due to the still enhanced atmospheric chlorine content (caused by CFCs). At the moment the consequence is that an ozone hole has developed within the boundaries of the polar vortex. The region of significantly reduced ozone values can be observed north of about 60°N.
On the one side the current meteorological situation of the stratosphere is unusual, on the other side the situation is definitely in the range of expected possibilities. Also earlier winters showed such dynamic situations in the Northern hemisphere showing stable and cold stratospheric vortices, for instance in March 2011. However, at that time the polar vortex was not as persistent. This year (winter 2019/20) the vortex was very stable for at least 6 weeks, from early February to mid-March. Therefore ozone depletion this spring was very much increased by these dynamic circumstances in the strong polar vortex.
In response to the international activities to protect the ozone layer (Montreal Protocol: multilateral environmental agreement of the United Nations, signed in 1987, and its follow-up agreements), due to the prohibition of the production and usage of ozone depleting substances (among others CFCs: chlorofluorocarbons) atmospheric concentrations of the chemical products have been clearly reduced over the last 20 years (by about 20%). Nevertheless, the current atmospheric content of CFCs is still enhanced and therefore also the chlorine concentration of the stratosphere is still relatively high. The reason is that the lifetime of CFCs in the atmosphere is high, which is several decades. Based on current scientific understanding the chlorine content is expected to reach normal conditions around the middle of this century, and therefore we can expect a full recovery of the ozone layer in the next 30 to 40 years.
In recent years, the beginning of ozone recovery was already detected. However, in the upcoming decades, in the polar regions ozone holes can still occur, in particular in the Southern hemisphere, but also in the Northern hemisphere under appropriate dynamic conditions (stable polar vortex). Monitoring of the Earth's atmosphere from space is important, and consequently the recovery of the ozone layer is carefully documented. Such data enables immediate scientific explanations of unusual atmospheric behavior, as detected this year.

Additional information:
The largest quantities of atmospheric ozone are found in the stratosphere, in the so-called ozone layer, with about 90% of ozone abundance being located at an altitude between 15 and 30 km. To specify the total amount of ozone found in the atmosphere above a specific location, the Dobson unit is used (DU, named after Gordon Dobson (1889–1976), who devised the first instrument for measuring atmospheric ozone content). Dobson units are column densities, which are a measure of the total amount of ozone in a column over a specific location. At standard temperature and pressure (1000 hPa, 273 K), an ozone layer of 0.01 mm thickness corresponds to 1 DU. An ozone layer of 300 DU at the Earth’s surface would thus correspond to a pure ozone column of 3 mm.
An ozone hole is said to exist when the total ozone column decreases to values of less than 220 DU, which is about 30% under the normal value.
If the rules of the Montreal Protocol are thoroughly implemented regarding the prohibition of CFCs one can expect a full recovery of the ozone layer including the polar regions by the middle of this century.
More figures and information with respect to the evolution of the stratospheric ozone layer over the Northern hemisphere can be found at https://ozonewatch.gsfc.nasa.gov/NH.html.

