Fire detection on Kilimandjaro - October 2020
Analyses of satellite data show the spatial extent of the forest and brush fires on Africa’s highest mountain and their development over time. It is also possible to analyse and predict the degree of biomass combustion. Comparisons with the disastrous fires in Australia (late 2019, early 2020) and in California during the past few weeks come to mind.
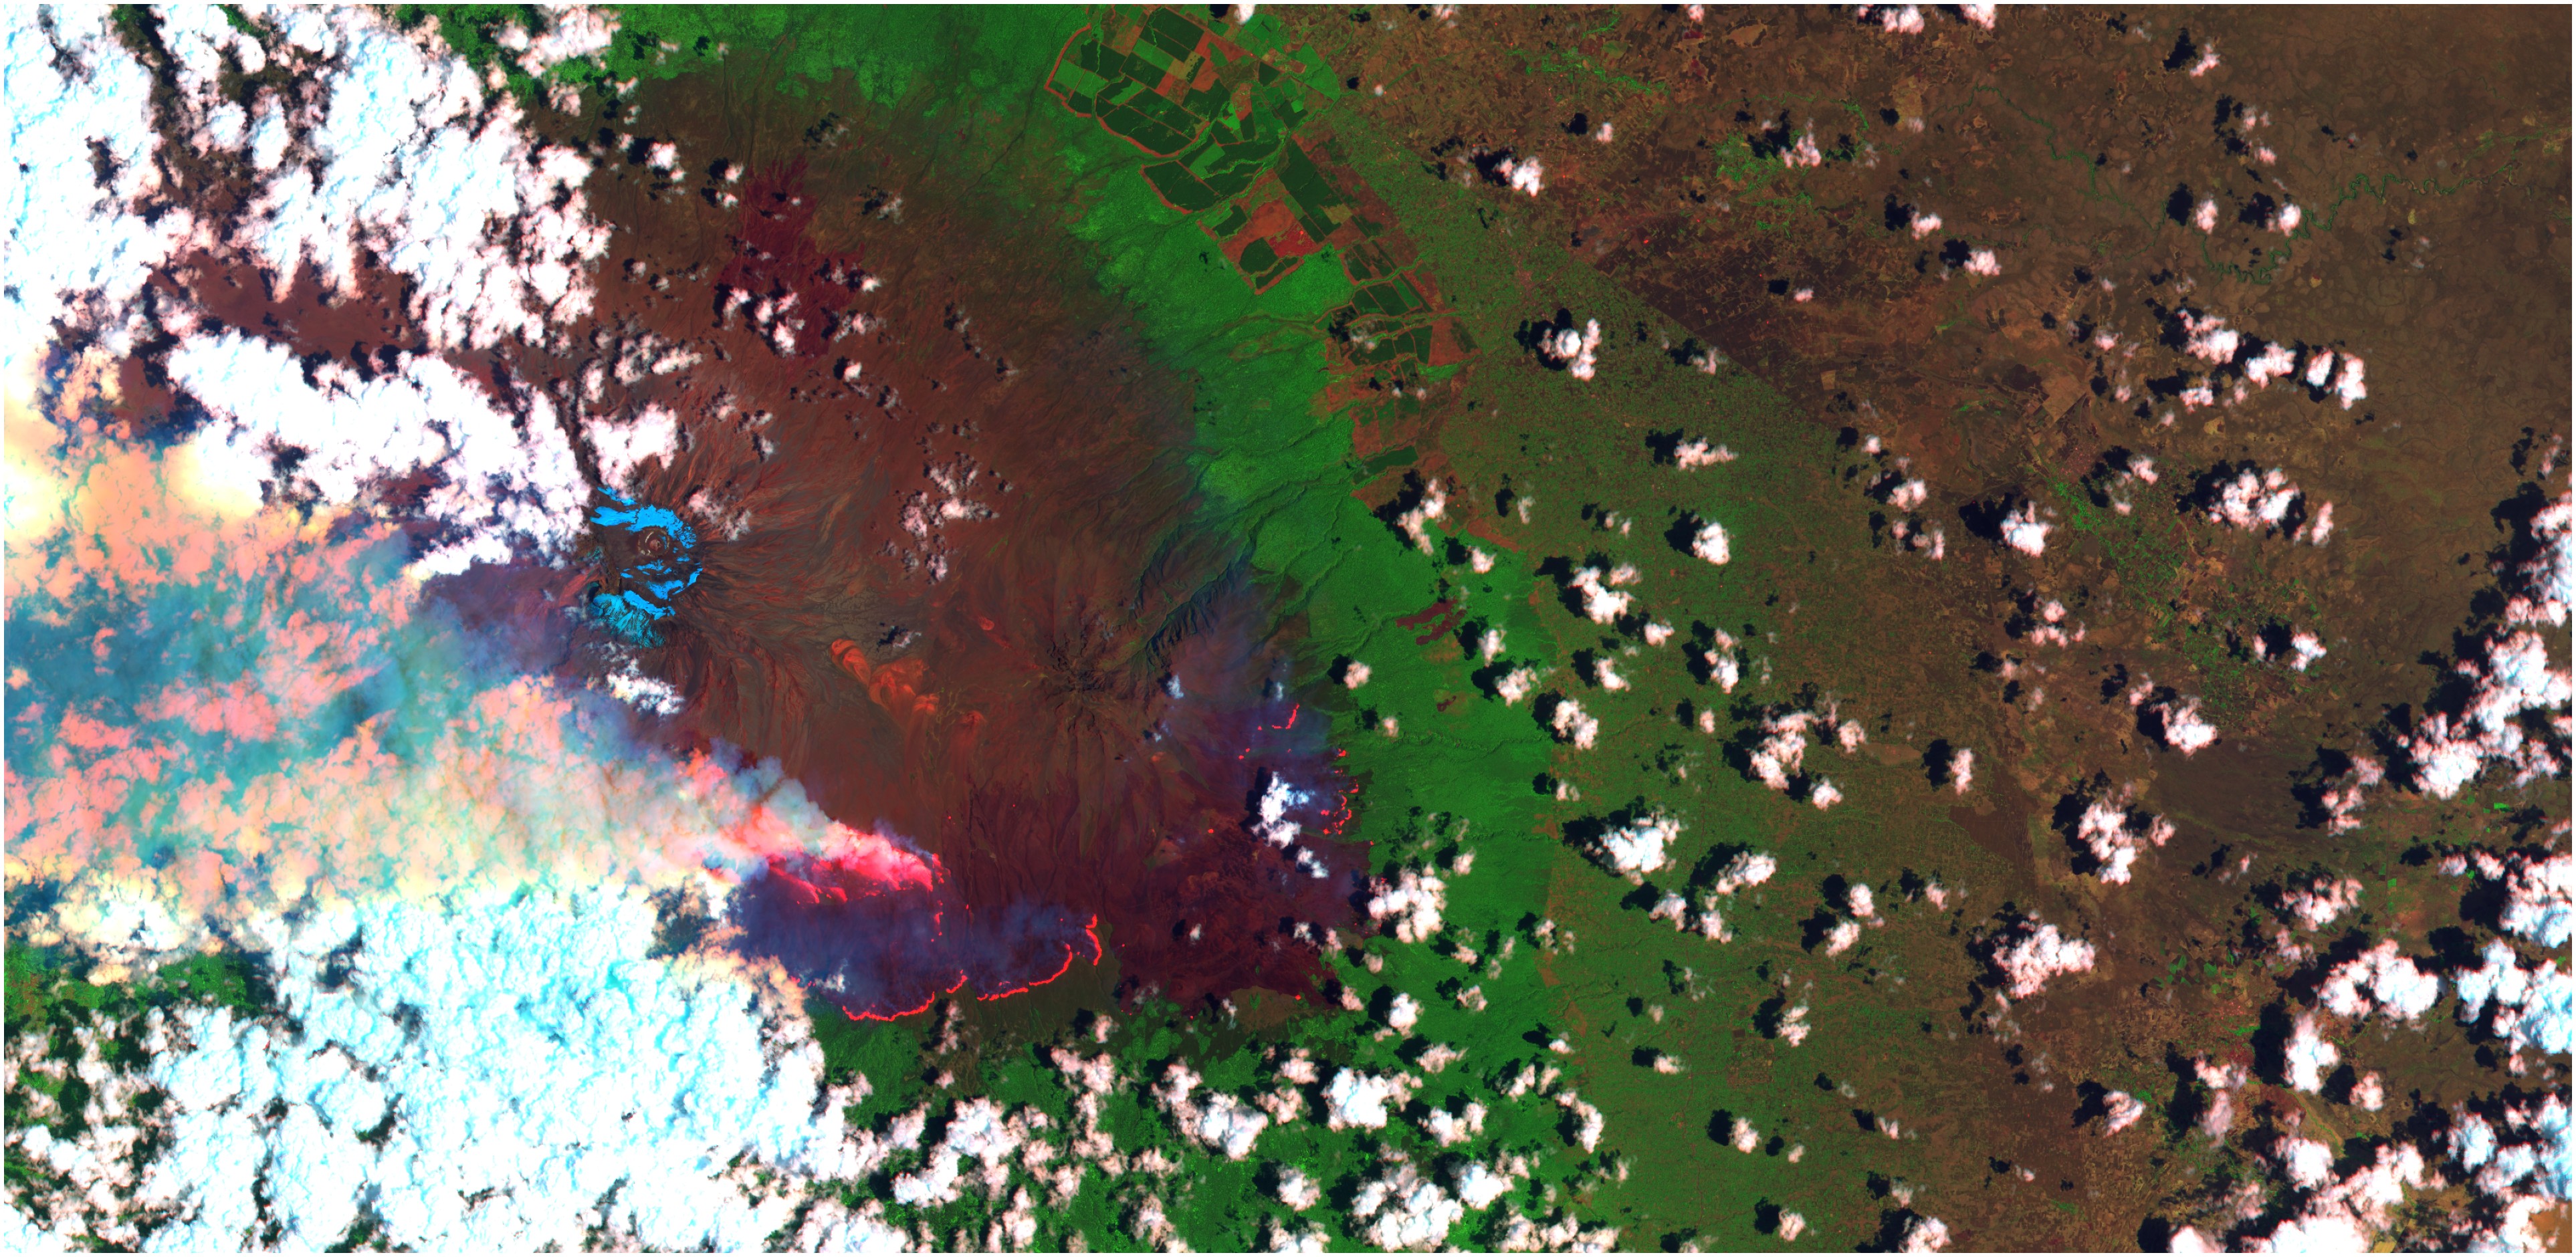
It took days to bring under control the fires raging on Kilimandjaro at 4,500 metres altitude. A pronounced period of drought had preceded the fires, and strong winds repeatedly fanned the flames of the fire front. In 1987 UNESCO had designated Kilimandjaro National Park a World Nature Heritage site and it is an important tourist region in Tanzania. Media reports point out that the current fire began along one of the main ascent routes for mountain climbers.
The decrease in healthy biomass per unit area is used as a proxy for the strength or intensity of the fire. This is determined by comparing several satellite images recorded before and after the fire. Each day, a Normalised Difference Vegetation Index (NDVI) is calculated for all available Sentinel-3 data sets containing the relevant segment. In the case of data from optical sensors this information can be derived only for cloud-free areas, which is why time series can have gaps.
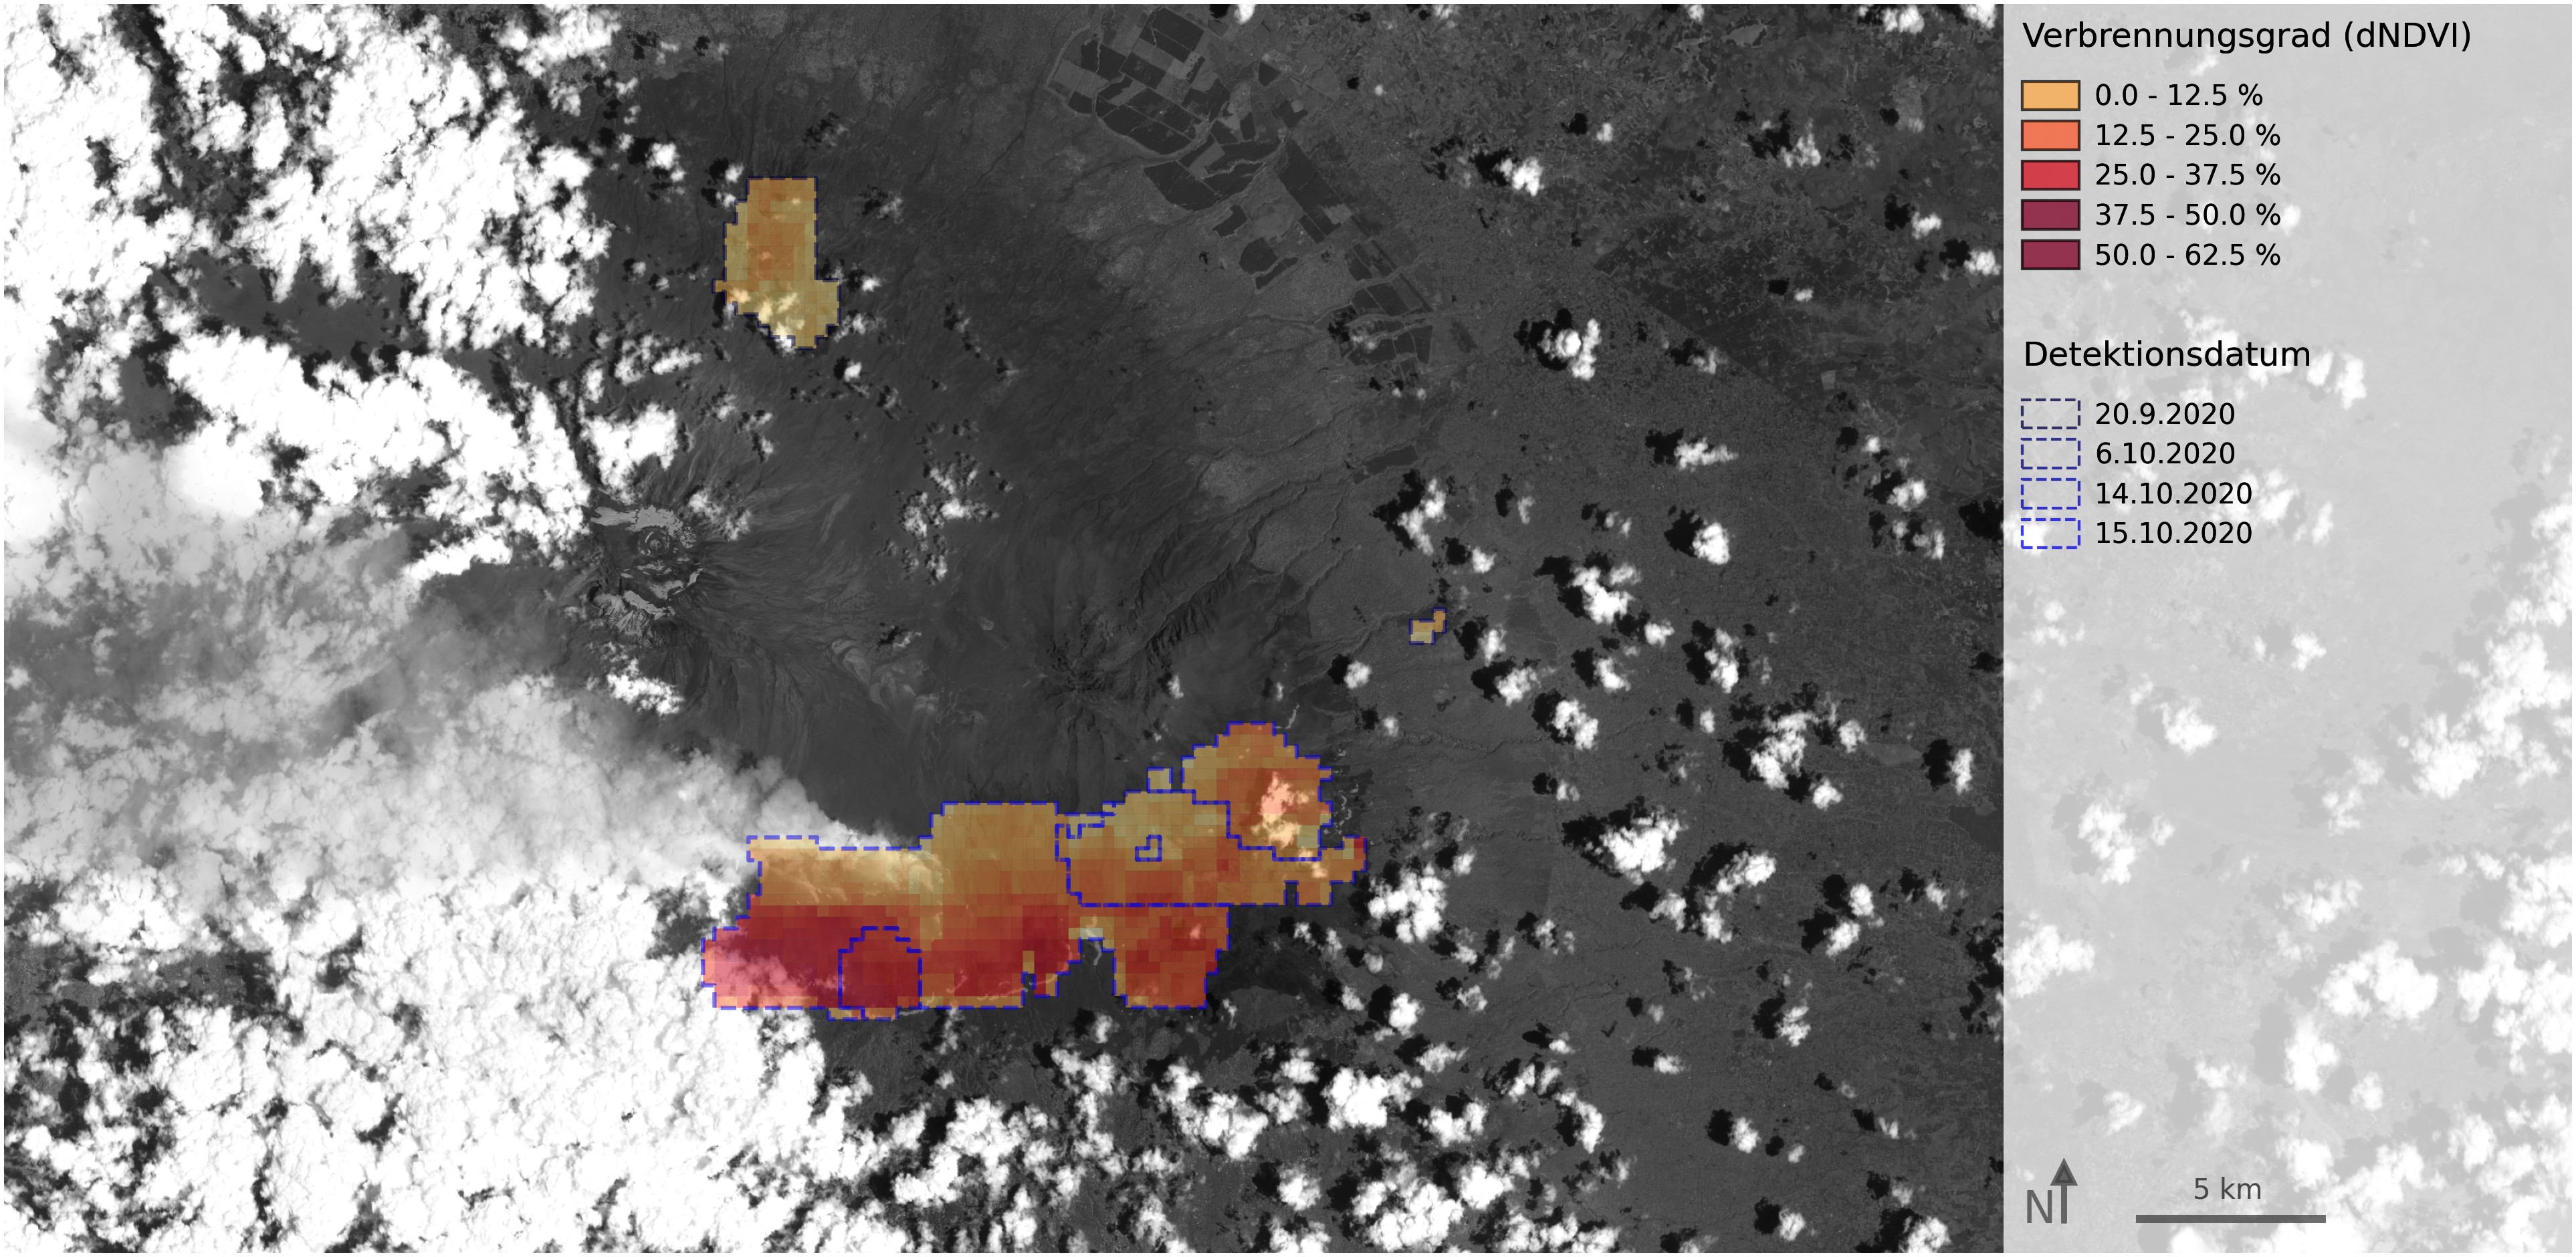
The results were generated using an automated procedure that was designed at EOC for monitoring large areas with mid-resolution optical satellite data. At present, all of Europe is being monitored in this way, with twice a day updating. The assessments shown are based on data from the OLCI Instrument (Ocean and Land Colour Imager) on Copernicus-Sentinel-3 satellites.
A total of about 94 km² have burned in the segment shown. The large burn scar in the south covers 83 km², equivalent to an area larger than 11,500 football pitches, or Bavaria’s Lake Chiemsee. It is the result of fires on three successive days (14 – 16 October 2020). The temporal sequence is indicated by the change in the hue of the surrounding blue-green dotted lines. The smaller area in the north is the burn scar from fires that took place end of September 2020.
The method used is being optimised in EOC research projects. The resulting data products and services are made available via the Center for Satellite Based Crisis Information (ZKI), a service of the German Remote Sensing Data Center (DFD).
Links

