Images in the visible light spectrum taken by NASA’s Solar Dynamics Observatory (SDO), showing the Sun during a solar minimum (left, December 2019) compared to a solar maximum (right, August 2024). During solar minimum, the Sun often appears 'spotless'. Sunspots are indicators of solar activity and are used to track the progress of the solar cycle.
Credit:
NASA/SDO
While records from ancient Greece and China show that people have been observing sunspots since ancient times, counting them only became possible with the invention of the telescope in the early modern era. Over time, astronomers have noticed a regular increase and decrease in the occurrence of sunspots, following a cycle lasting approximately 11 years. These cycles were numbered, beginning with Solar Cycle 1, which started with the sunspot minimum of 1755. By this count, the Sun is currently in Solar Cycle 25.
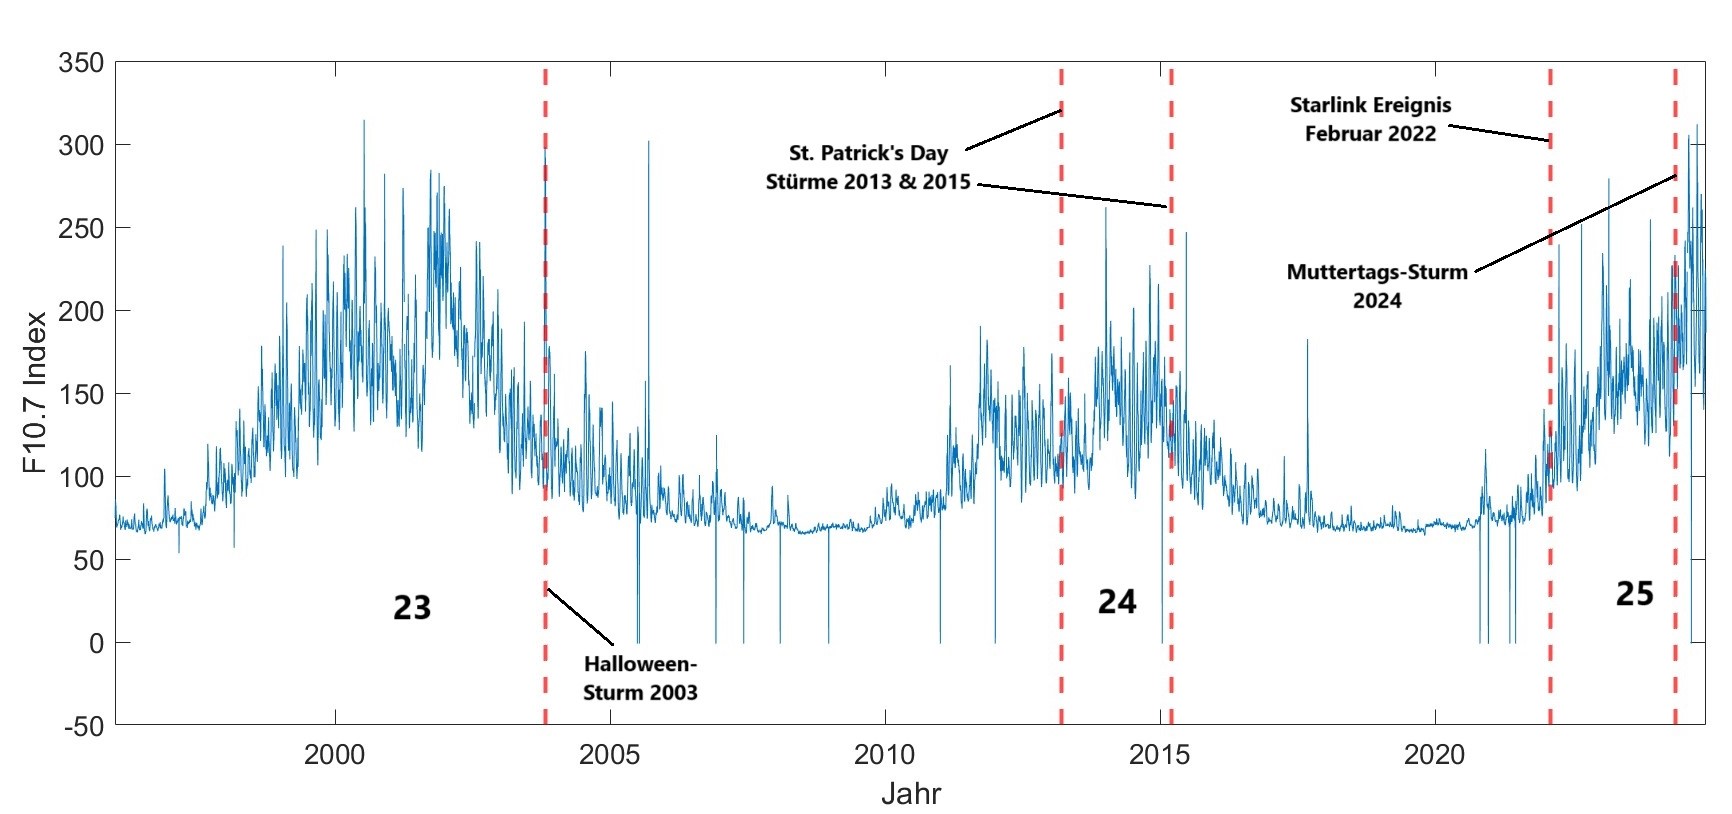
Sunspots are formed as loops of magnetic field penetrate the surface of the Sun. A greater number of sunspots increases the likelihood of a mass ejection from such a loop, potentially leading to the formation of a solar storm. The intensity of ionising radiation also increases during a solar maximum, with the F10.7 index often used as an indicator of the intensity of extreme ultraviolet radiation.
Researchers are now investigating whether and how changes in radiation output during a solar cycle affect Earth's lower atmosphere – its weather and climate. In the past, some observers hypothesised a link between solar cycles and grain prices, although this has been refuted.
From the Maunder Minimum to the Mother's Day Storm
The strength of individual solar cycles fluctuates significantly. There have been several periods in the past in which the number of sunspots remained very low even during a solar maximum.
The most well-known example is the Maunder Minimum (named after the astronomer Edward Maunder), which describes a period of several decades in the late 17th century when hardly any sunspots were observed. Researchers are still investigating a potential connection between this period and the Little Ice Age, which began shortly before the Maunder Minimum.
Index of Solar Cycles I
Selected major space weather events since records began in 1750.
In modern times, the strongest solar maximum ever measured occurred in the late 1950s, after which solar activity declined again. The maximum of Solar Cycle 24 took place in 2013/2014 and was comparatively weak.
The current Solar Cycle 25 has seen a significant increase in sunspot numbers, resulting in the major Mother's Day Storm in May 2024. According to NASA, Solar Cycle 25 reached its maximum in October 2024, and further strong solar storms can be expected throughout 2025.
Index of Solar Cycles II
A closer look at periods of low and high solar radiation in recent history.


