Overview of data compilation from 35 research teams

Overview of data compilation from 35 research teams
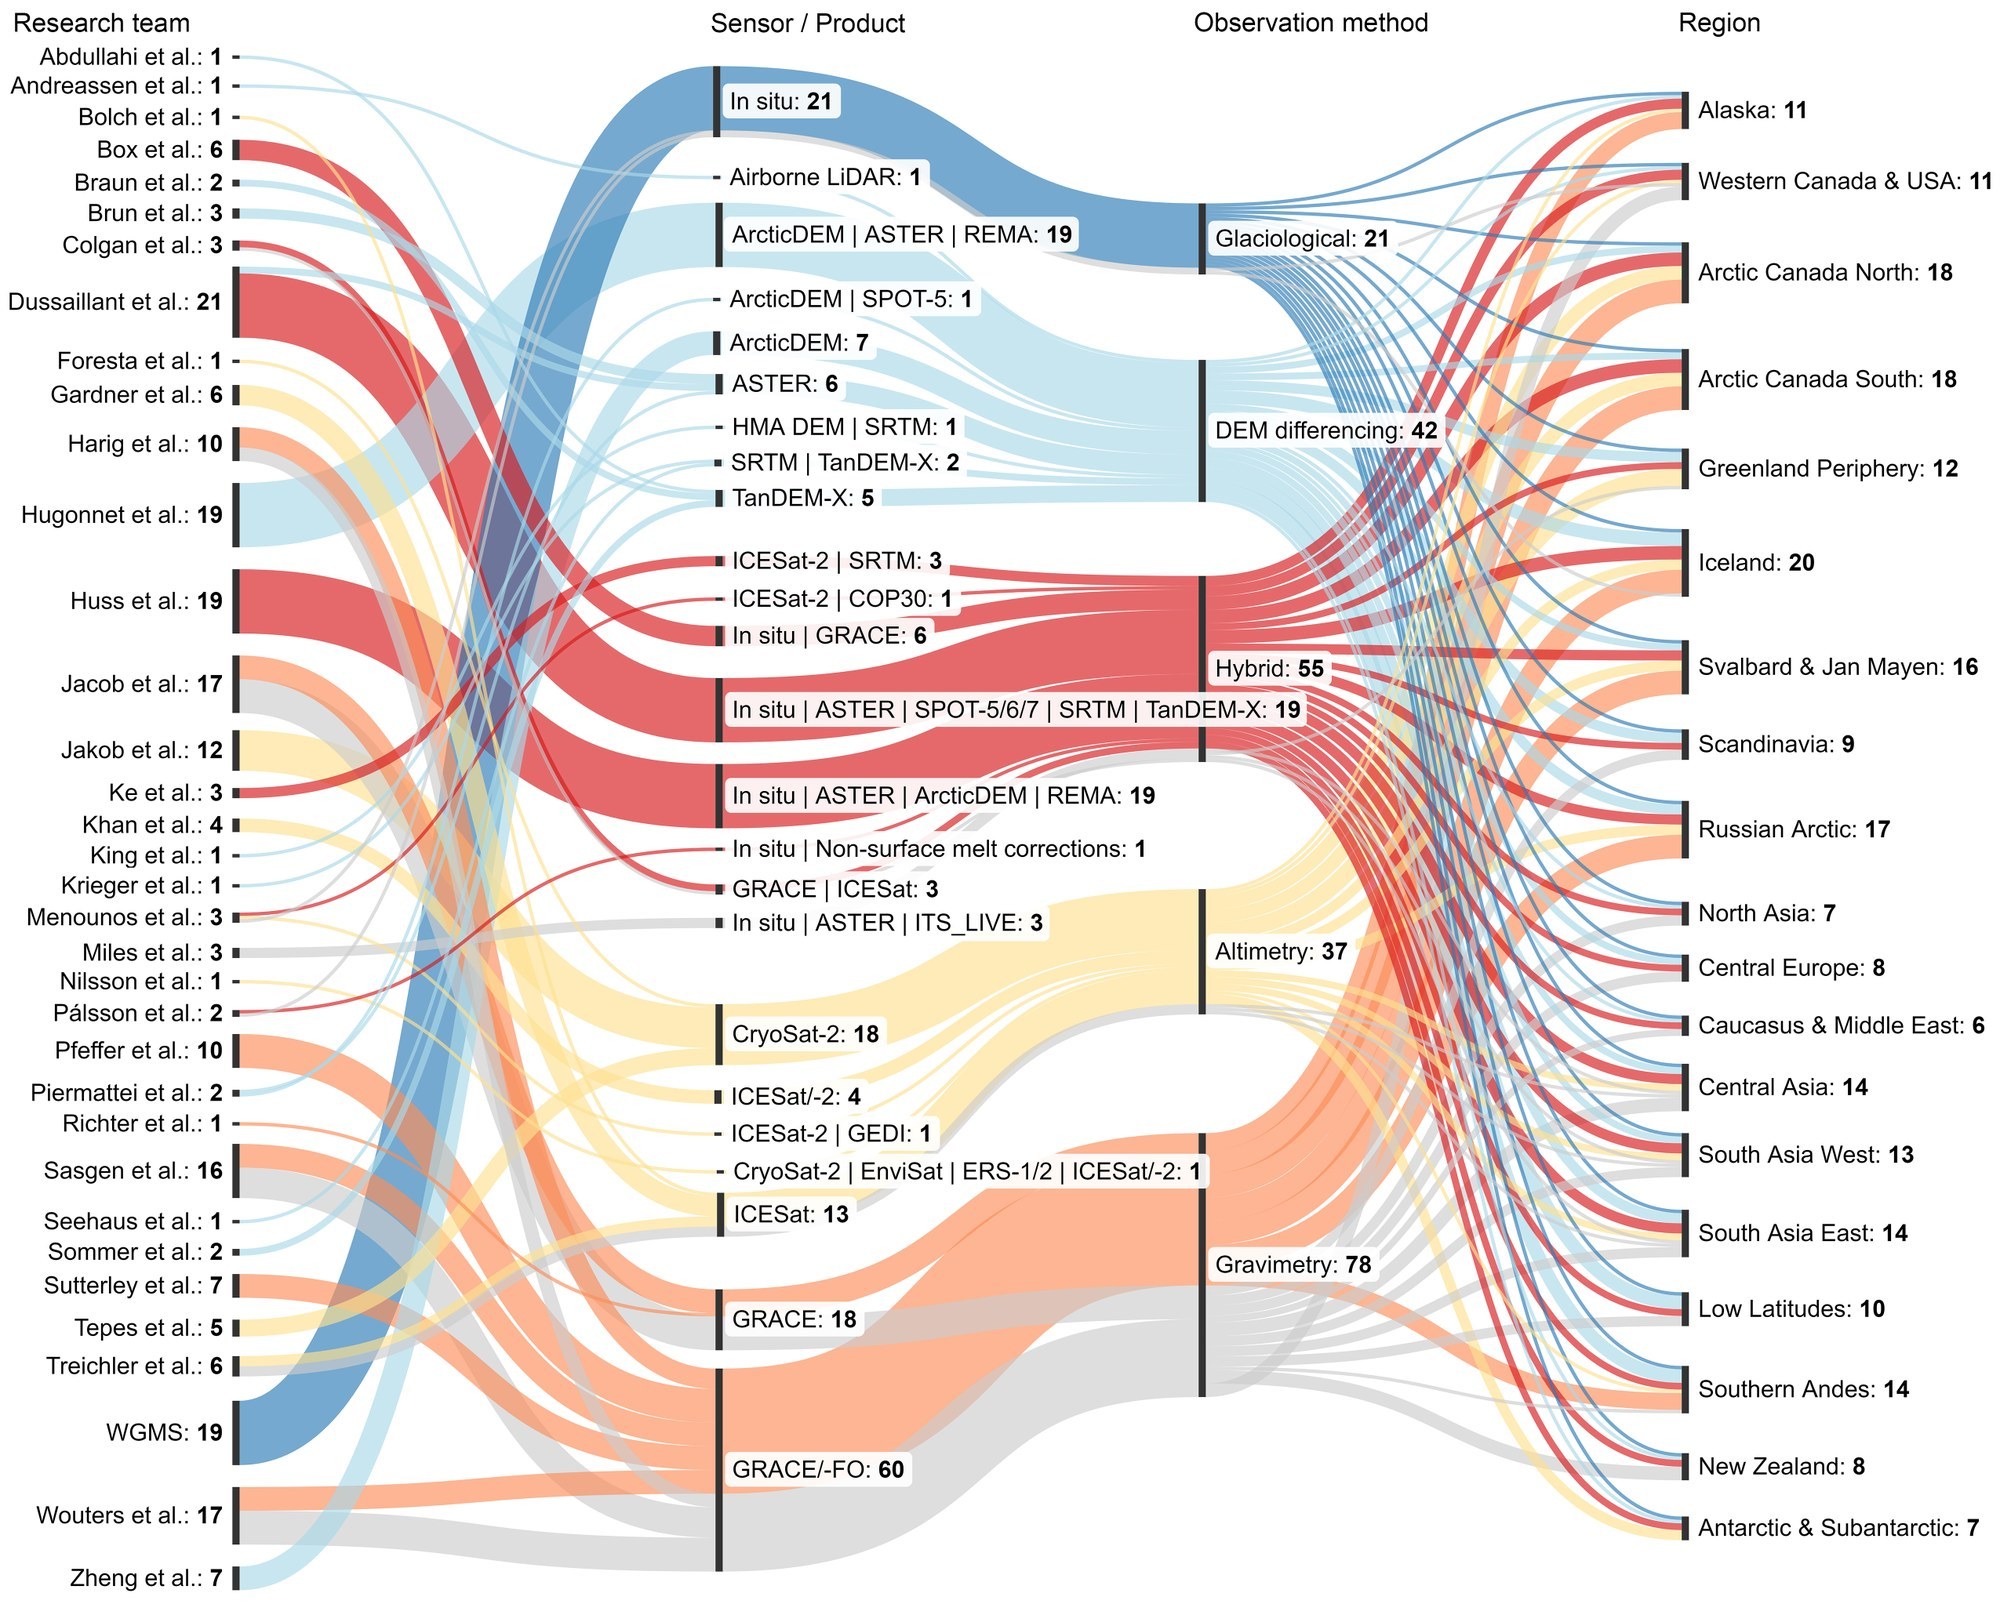
This figure provides an overview of research teams participating in GlaMBIE (left, in alphabetical order), along with their selection of sensors or products (middle left) used for computing glacier mass-change estimates from different observation methods (middle right) for the 19 studied regions (right). From the 233 regional results, 195 were used to compute combined estimates (coloured lines), and 38 were excluded based on regional confidence levels of observation methods (grey lines). Colours follow observation methods. The figure was created using SankeyMATIC (https://sankeymatic.com/build/).
Credit:
The GlaMBIE Team (2025). Nature.