
Signature analysis


Figure 4: Simulated SAR signature of a Boeing 747 overlaid with color-coded scattering effects
Firstly, prominent scatterers can be color-coded according to their effect’s cause. Figure4 shows the simulated signature along with the color-coded prominent scattering effects of the object. Single-bounce scatterers are in yellow, edges in orange, double-bounce in green and finally multi-bounce effects in light blue.
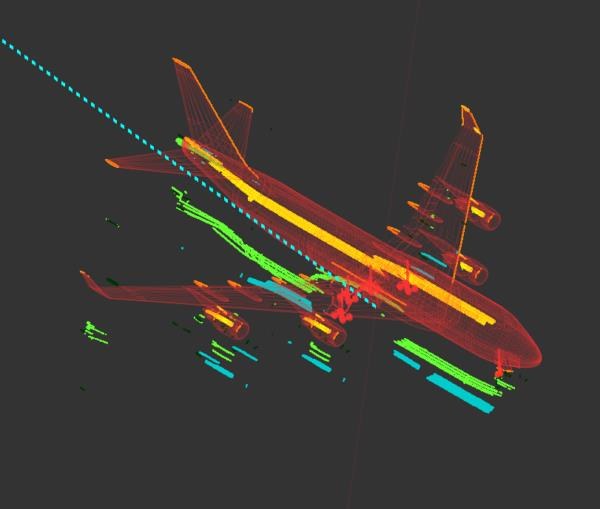
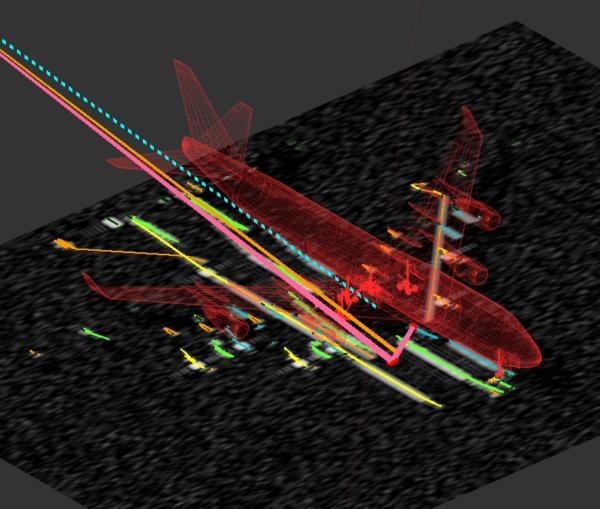
Figure 5: Analysis of scattering effects by means of visualization of beam paths
Additionally the position of the scattering centers can not only be extracted in 2-D in the SAR image plane, but also in 3-D along with a transparent overlay of the wireframe model data, as can be seen from Figure 5. The stippled line in light blue indicates the simulated radar sensor’s line of sight.
Image: 2/3, Credit:
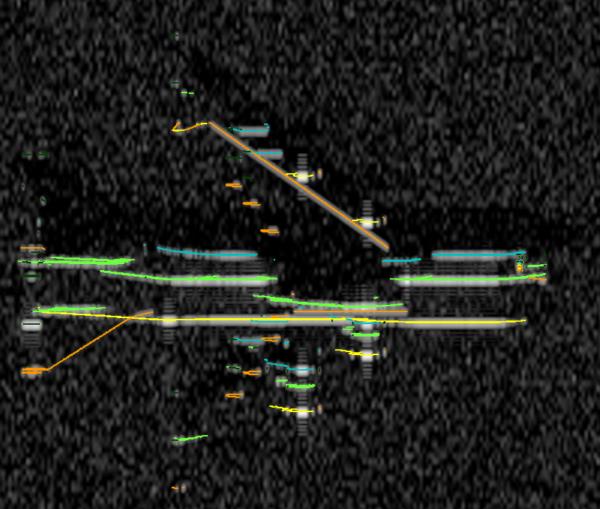
Figure 6: 3-D model with color-coded prominent scattering centers
Last but not least, the cause of prominent scatterers can be analyzed in a very convenient way by showing their ray-path. This has been done for a multi-bounce effect in Figure 6 which shows that it is caused by triple reflection between the airplane’s fuselage and the smooth tarmac ground.
Image: 3/3, Credit: