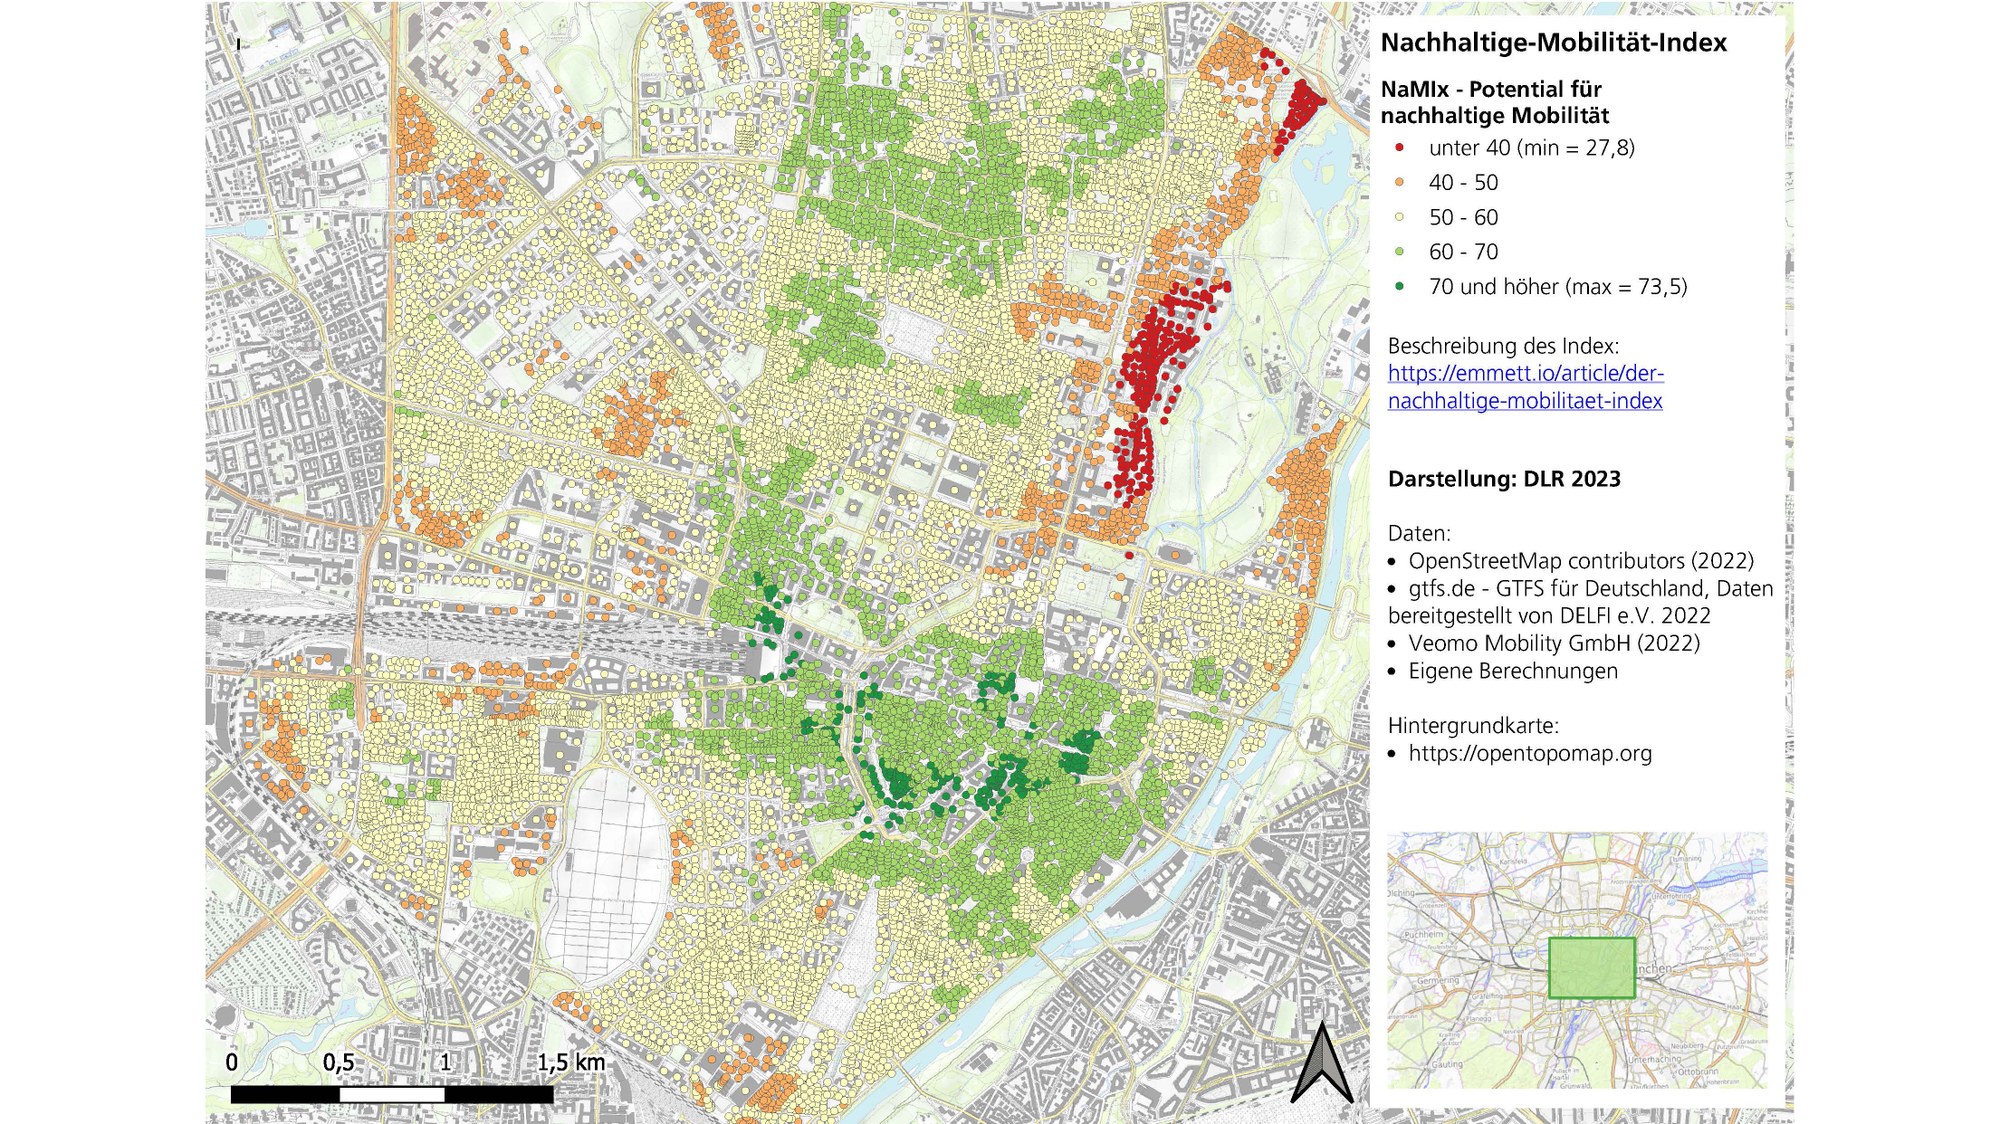
NaMIx overview map
NaMIx overview map
The Sustainable Mobility Index describes the potential for travelling in an environmentally friendly and resource-saving manner. The index assesses this potential for each address in the study area, illustrated in the image using the example of Munich. For this purpose, the researchers introduced a rating scale ranging from 10 (lowest) to 100 (highest).

