Measured and modelled surface temperatures of Comet 67P
Measured and modelled surface temperatures of Comet 67P
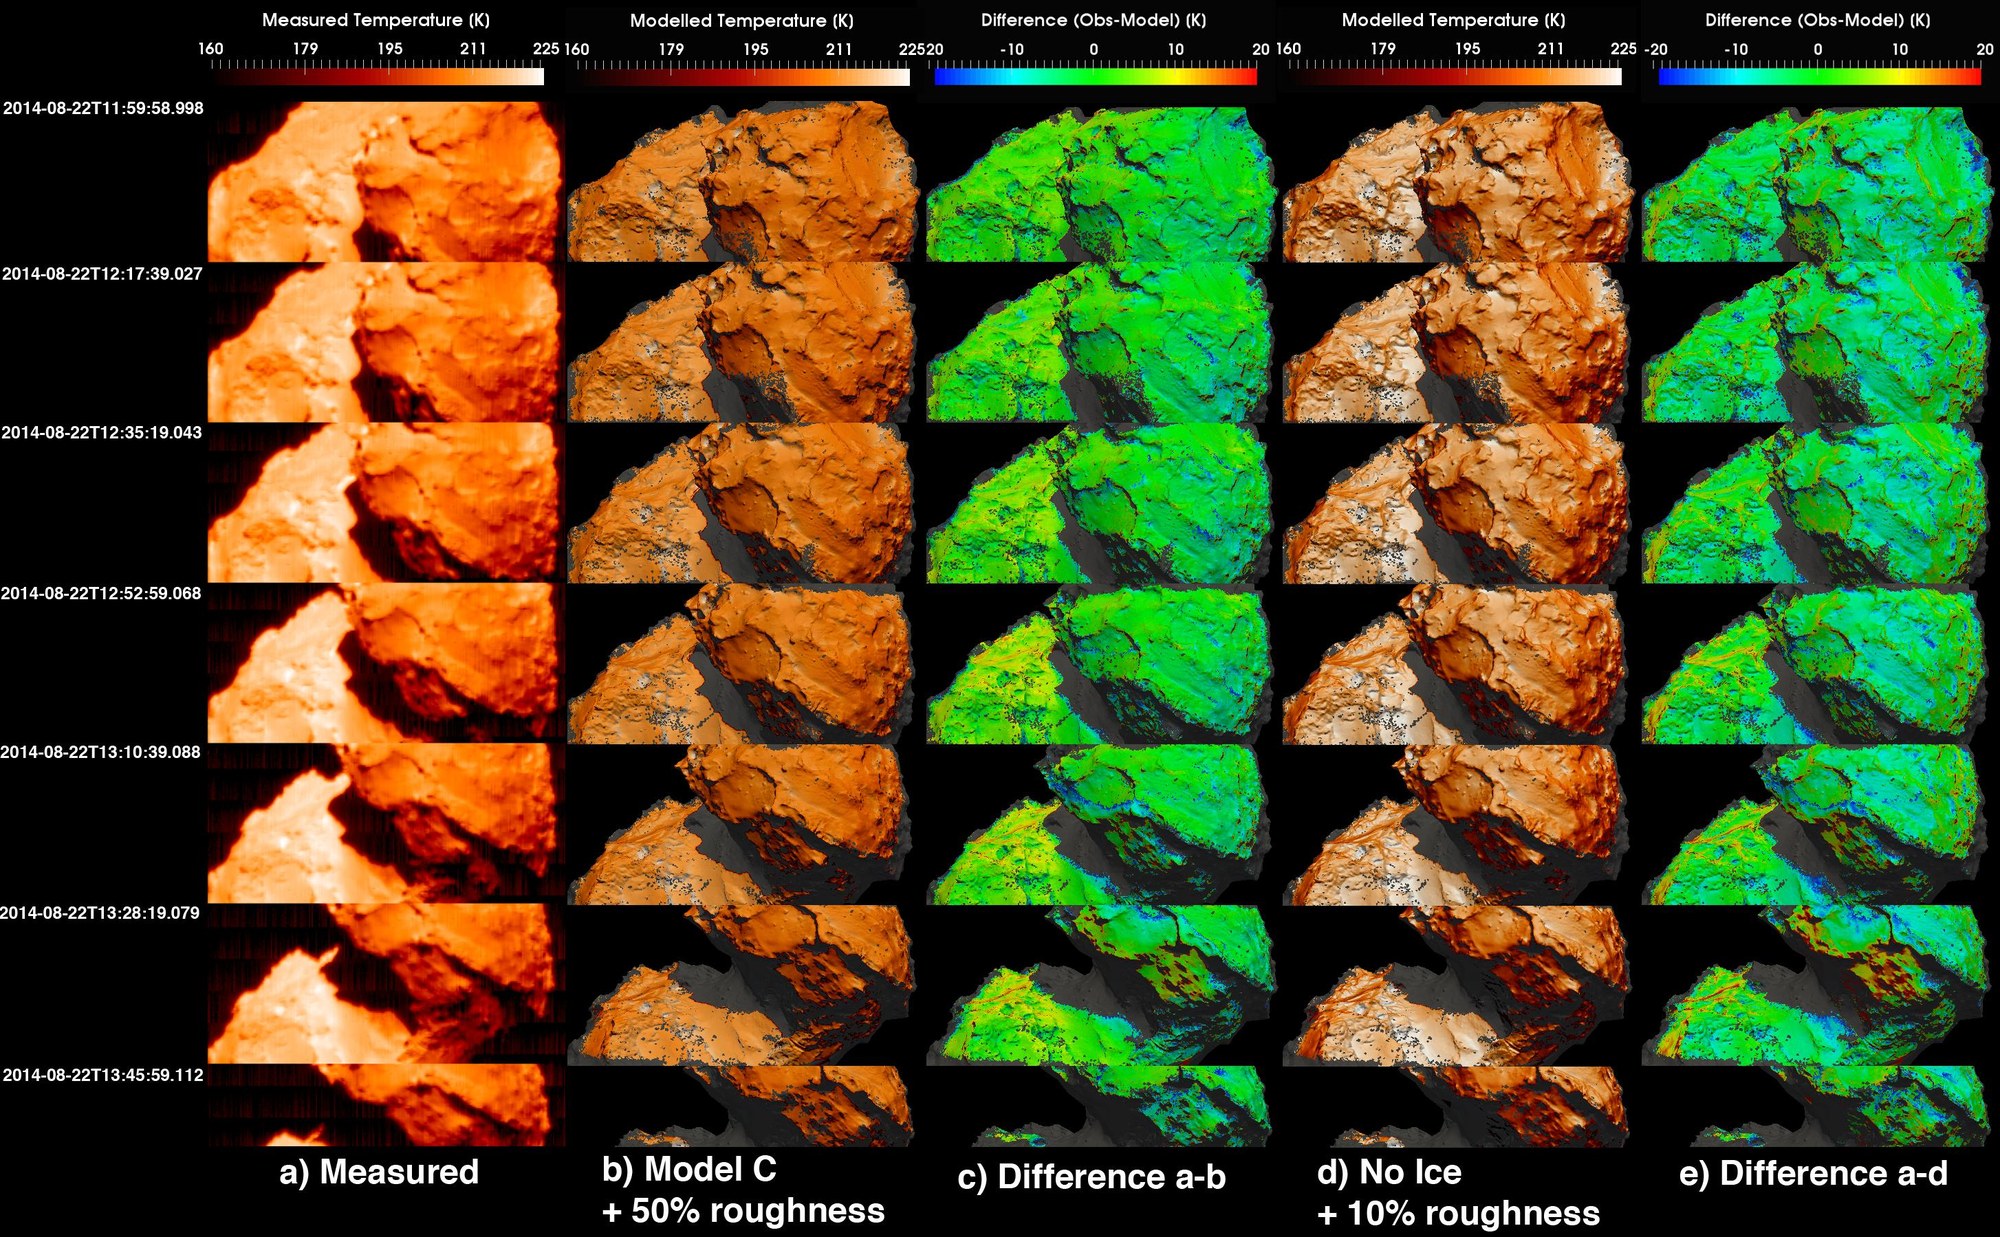
(a) Thermal image derived from the VIRTIS data of 22 August 2014, acquired at a distance of 60 kilometres above the comet surface (spatial resolution 15 metres per pixel). The coldest temperatures are shown in dark red tones, while the warmest temperatures are whitish. (b) Result of thermophysical modelling (see original paper) for the same period of time as the VIRTIS observations shown in (a). The grey (shaded) colouring indicates points with modelled temperature values lower than minus 113 degrees Celsius, for which neither the VIRTIS data nor the model can provide accurate values. Other spurious grey dots are due to the projection of the data onto the shape model. (c) Difference between the temperature values measured by VIRTIS and represented in (a), and the theoretical temperature values shown in (b). In this image, the blue and blue-green colours mark areas of the nucleus where the modelled temperature values are significantly greater than the measured ones, while the inverse relation is indicated by the colours from yellow to red. The green colour shows areas where there is substantial agreement between the observed and calculated data. (d) Result of thermophysical modelling with no ice and 10 percent surface roughness. Colour coding is as described above for (a). (e) Difference between the temperature values measured by VIRTIS and represented in (a) and the theoretical temperature values shown in (d). Colour coding is as described above for (c).

