
Application of Pressure Sensitive Paint: Transonic flows
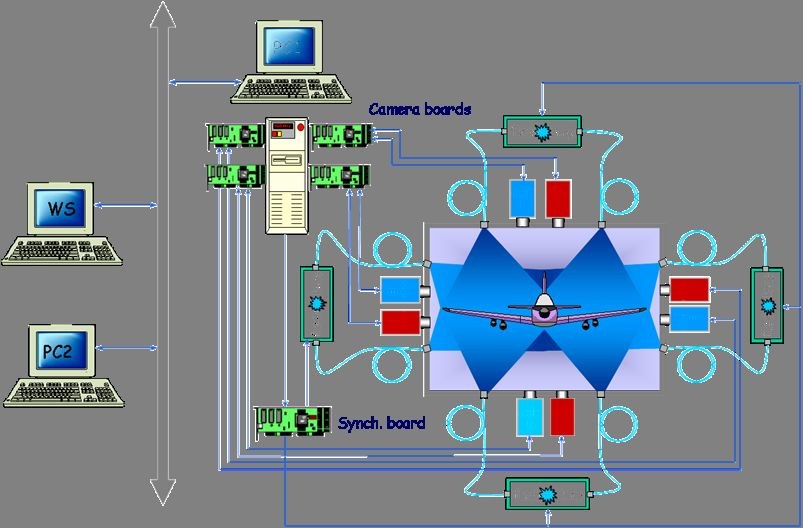

Up to now the best results have been obtained with PSP in transonic speed ranges because of the high absolute pressure differences. The main challenge to get acceptable PSP results on one hand is the arrangement of hardware, components of model illumination and camera observation - especially in the handling of eight simultaneously operating CCD cameras. On the other hand the software should be able to handle in a short time all the necessary synchronization between PSP-system and wind tunnel.
In the following it is described how these problems were solved at DLR. A large number of results were obtained in different wind tunnels and on different models. The example shown here is based on the PSP measurements on an EADS MAKO aircraft model in the transonic DNW-HST wind tunnel at Amsterdam.
For each observation direction one UV light source was used and each was connected to fibre optics. Eight cooled CCD cameras with 12-bit resolution were used for image acquisition. In this arrangement, minimum exposure times of about 10 s for a typical distance of 1.0 m between the cameras and the model could be realized. A two camera system for pressure and reference images was used to obtain the necessary signals. The filters employed separate the emitted light as follows: one filter at 450-550 nm for the pressure signal itself (called “blue”); and one filter at 600-650 nm for the reference component (called “red”). Thus, pairs of images have been acquired in parallel by using the twin CCD-camera system from each viewing direction.
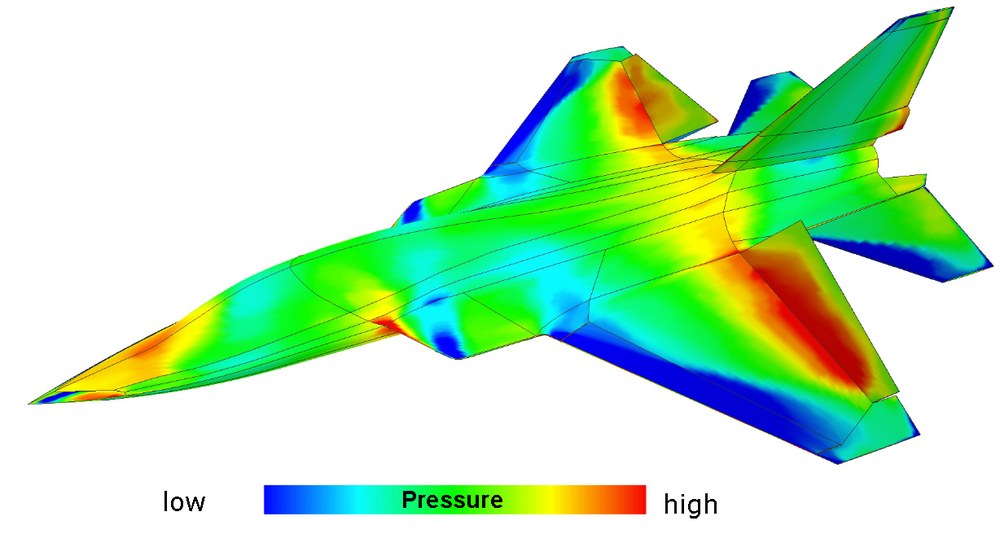
A typical PSP result for the investigated model is given in the second figure. The two dimensional PSP images have been mapped to the structured three dimensional grid of the model. All the different viewing information of the eight installed cameras must be merged to get the complete view of the pressure distribution on the model surface. The color bar gives the relationship between the color shown on the model surface and the calculated pressure values based on the intensity values measured with PSP. The pressure distribution in this figure shows clearly the vortex trajectories as “footprints”. Complex vortex interactions can therefore be easily visualized already only few minutes after taking the raw images by making several measurements for different angles-of-attack and Mach numbers.
The comparison of the measured pressure coefficients with the PSP technique and the conventional pressure tap technique shows a good agreement. In average on each grid point of the model a standard deviation of ΔCp <= 0.05 was achieved. The final data format (TecPlot or NetCDF) is compatible with numerical results.
By integration of measured pressures with the PSP system forces and moments can also be calculated and compared with internal balance data.