Deformation velocity map


Deformation velocity map
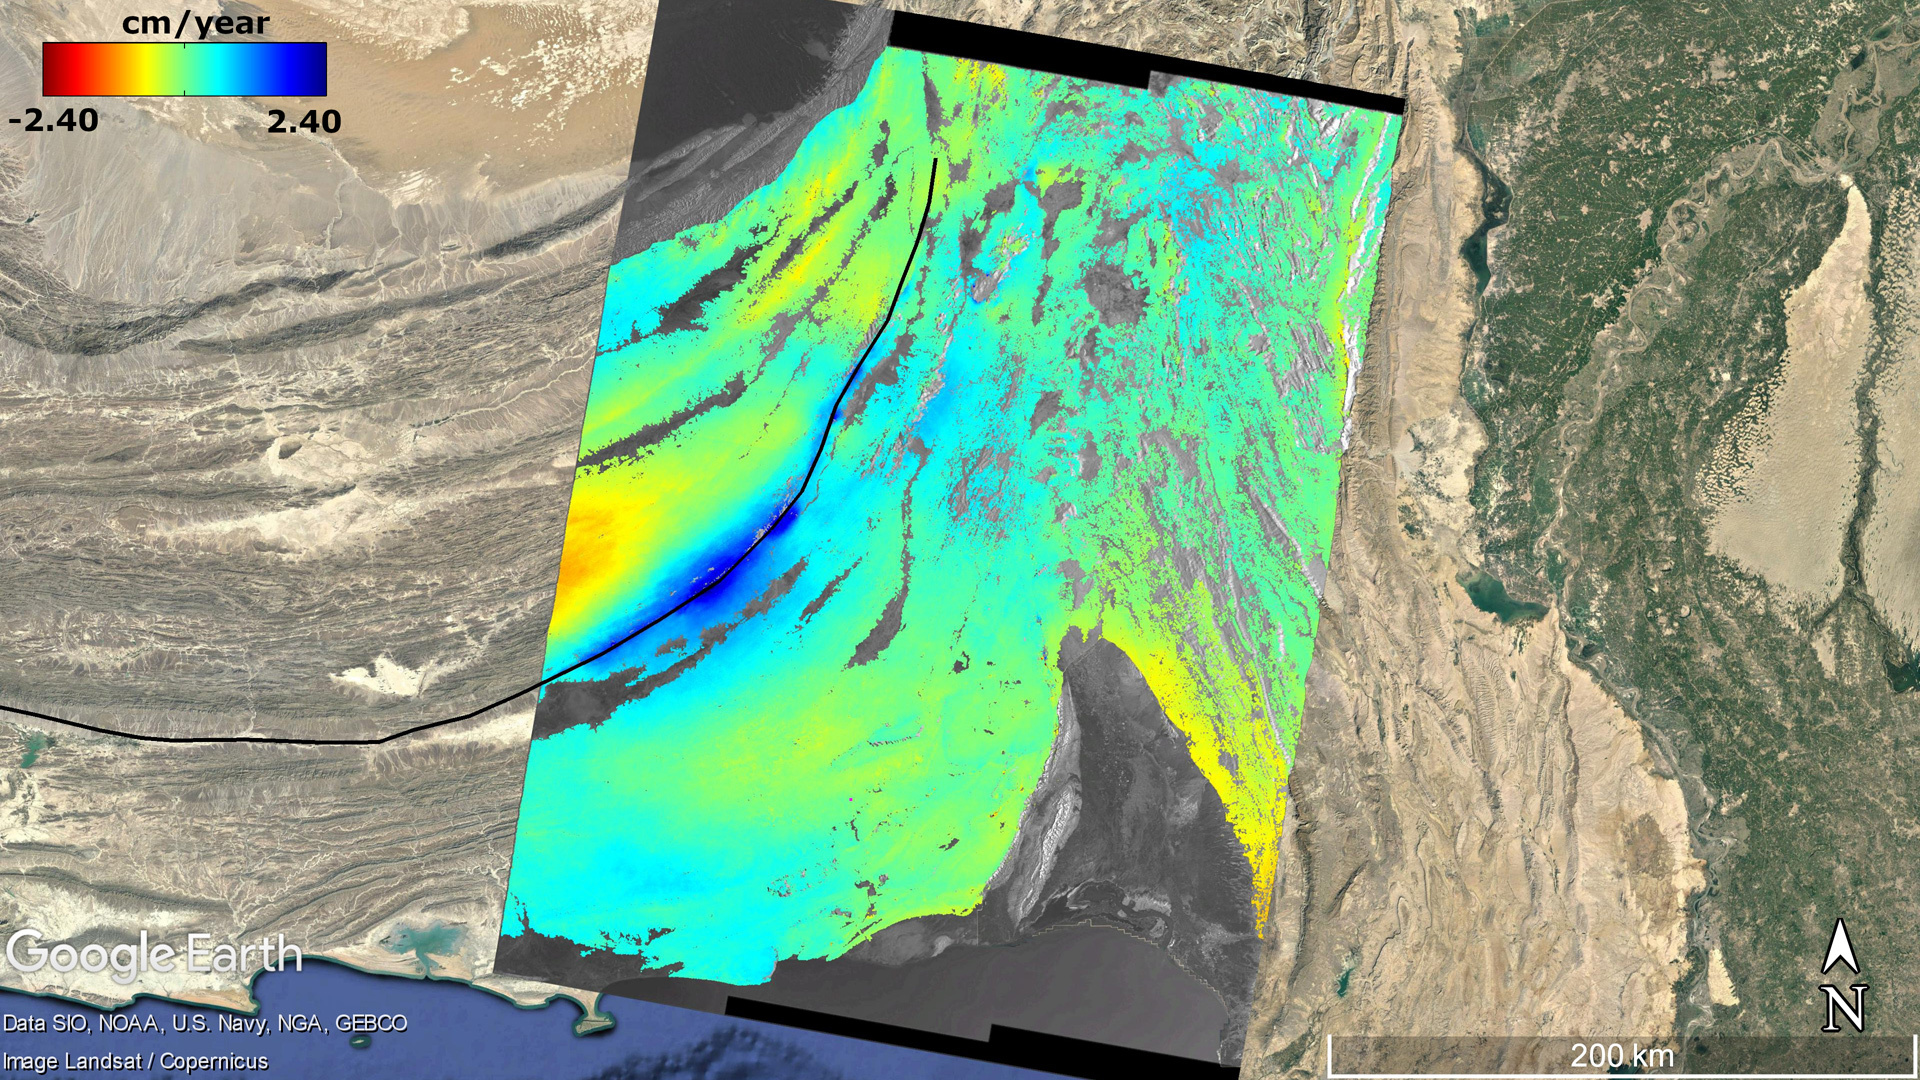
Map of deformation velocity created using 50 Sentinel-1 images acquired over the Hoshab Fault (indicated by the solid black line) in Balochistan, Pakistan. The colours indicate whether the Earth's surface is moving away from the radar (red colour) or towards it (blue colour). The movement is mainly parallel to the fault, which is mostly oriented north-south, on its right side. Since the satellite follows a quasi-polar orbit (mainly north-south oriented) and the radar looks 90 degrees to the right, it cannot detect the movement taking place on this part of the fault. It is only when the fault begins to bend in an east-west direction that the movement is detected, as can be seen from the reddish area to the left of the Sentinel-1 image. The special configuration of the Harmony satellites will enable the accurate measurement of the north-south component of the deformation and thus the observation of three-dimensional deformation phenomena worldwide.