World Settlement Footprint - Where do humans live?

After three years of meticulous data processing and comprehensive quality control, the World Settlement Footprint 2015 is now available. With a resolution of 10 metres, the new world map reveals settlement structures on Earth in 2015.
At first glance, knowing where humans live is a given. Indeed, many people are familiar for instance with freely accessible web services (e.g., Google Maps, Bing Maps, OpenStreetMap, etc.), which feature detailed building outlines among their content. Nonetheless, if one starts focusing on low/middle income countries – especially in rural and suburban areas – it is immediately clear how even information on the overall extent of human settlements is actually not available for the vast part of the world. Bridging this gap has become one of our main goals. Since 2012 the Smart Cities and Spatial Development team of DLR's Earth Observation Center (EOC) has been using satellite data to map human settlements on a global level with high accuracy. The new World Settlement Footprint (WSF) gives an overview and insight into urban structures in the year 2015: The 'WSF2015' is now publicly and freely available here.
In this framework, different high spatial resolution layers outlining the global settlement extent have been published in the last few years. Among these, back in 2016 we released the Global Urban Footprint (GUF), which has been generated at a resolution of 12 metres from 2011-2013 radar satellite imagery acquired by the TerraSAR-X and TanDEM-X satellites and outperformed all other similar products. However, the GUF itself still exhibited two major drawbacks. On the one hand, it was generated (as the other existing layers so far) from single-date scenes, which are sometimes strongly affected by the specific acquisition conditions, thus resulting in misclassification errors. On the other hand, commercial imagery was employed, which prevents a systematic update due to its high costs.
To overcome these issues, we have then started developing a new 10-metre resolution product which jointly exploits, for the first time, open-and-free multitemporal data, namely the World Settlement Footprint (WSF) 2015. In particular, the WSF2015 first combines 2014-2015 mass optical and radar satellite imagery acquired by the Landsat-8 and Sentinel-1 satellites, respectively. These datasets proved complementary as they are sensitive to different structures on the ground (i.e., artificial surfaces and built-up areas, respectively).
The implementation of the WSF2015 has been a long journey, which, starting in 2016, took more than three years to complete. Specifically, we put all our efforts to generate an open-and-free dataset that is highly accurate and reliable, and might effectively support all applications requiring detailed and accurate information on human presence (e.g. to model the displacement of people, assess how many are living in risk areas, estimate food and energy consumption, or conduct detailed epidemiological analyses just to cite some). On the one hand, when the activity started in 2016, we still had to face quite a few technological challenges (especially related to the computational-demanding data pre-processing) that the ongoing advancement in cloud computing has nowadays made simpler. On the other end, we performed an endless visual comparison of the intermediate results against Google Earth imagery to continuously refine and improve the final methodology. Here, human settlements exhibit completely different features around the world mostly depending on the corresponding climate region. Hence, empirical evidence collected from this quality check exercise has been translated in specific implementation constraints. This ultimately allowed us to properly delineate not only major urban areas but also smaller settlements, in suburban and rural regions, where about half of the global population continues to live.
The quality of the WSF2015 has been quantitatively assessed by means of an extensive validation carried out in collaboration with Google based on a huge amount of ground-truth samples (e.g. 900,000) labelled by crow-sourcing photointerpretation. In particular, a statistically robust and transparent protocol has been defined following the state-of-the-art practices currently recommended in the literature. Thanks to the experience gained and the improved processing capabilities now we can repeat the same “exercise” in a shorter time, which will lead us to release the new WSF2019 in early 2021.
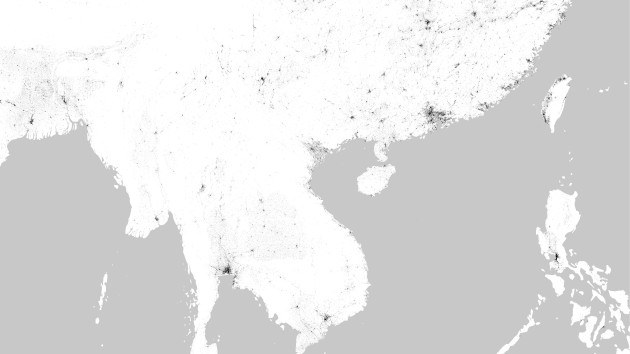
The figures below showcase the WSF2015 for a subset ranging from India to China which also includes part of South East Asia, as well as for a portion of Western Africa ranging from Ghana to Nigeria. Yet at this scale it is immediately evident how, besides the major cities, the layer also outlines the thousands of medium and small-size settlements scattered in the corresponding rural regions.

The WSF2015 is publicly and freely available through a dedicated figshare repository. Furthermore, in addition to the original 10-metre resolution dataset, five resampled versions are also provided at 100 metres, 250 metres, 500 metres, one kilometre and 10 kilometres respectively, reporting for each pixel the corresponding ground percent surface covered by settlements.
Tags:
