Where and how does ice move in the ocean?
The data obtained was also used to study the dynamics of sea ice. Since this unique configuration of the satellite constellation lasted just a few months, we were only able to schedule and implement a small number of joint data acquisitions during the verification and validation programme for the younger satellite, TanDEM-X. We reported on a few of these experiments in this blog, and since then, additional analyses have become available.
Today, I'm introducing a study on the dynamics of sea ice. To obtain a swath width of 100 kilometres, both TerraSAR-X and TanDEM-X were run in ScanSAR mode for this study. We selected an area on the northeast coast of Greenland for our first study to capture land as well as water and sea ice in a single image.

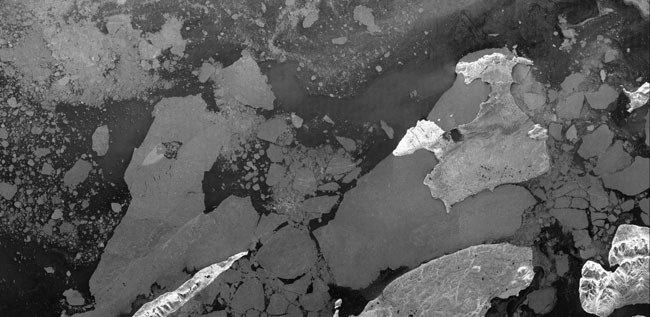
Sea ice off the coast of Greenland. The data acquisition for this image was performed by TanDEM-X on 2 August 2010, using ScanSAR mode with a swath width of 100 kilometres. Image credit: DLR.
Although the data was acquired in the height of summer, plenty of ice remained along the coast of Greenland, as can be seen from the strong backscatter of ice floes of all sizes. Various offshore islands and headlands are also visible. The unusual thing about these images, captured by the TerraSAR-X / TanDEM-X pair, is the short time delay between the acquisitions, which allows for multi-point, and consequently unique, measurements of the movements of individual ice floes to be made. Since each satellite captures reflected radar signals under almost identical geometric conditions, information about the movement of the ice floes can be extracted from the minimal time differences and interference patterns.
For example, the interferometric phase image of individual ice floes reveals a cyclic phase pattern in the direction of flight (varying colours), indicating that within the three-second time delay between the two image acquisitions, something in the captured scene has changed. The closer the spacing of the phase pattern, the further the ice floe has moved.

Interferometric phase; each colour cycle represents a shift of half a wavelength, that is, 1.5 centimetres. Image credit: DLR.
The rotation of the ice floes about their vertical axis causes this phase pattern phenomenon; land topography, however, produces a less regular phase variation. Areas of sea ice are largely flat and present a constant phase value when the floes are stable. Evaluating the interference pattern for each ice floe results in an extremely sensitive measurement of the ice dynamics – their rotation in this case.

Rotation angle of individual ice floes; the angular range of measurements corresponds to a coloured scale representing a rotation angle of -0.005 degrees (yellow to red) to +0.005 degrees (blue to violet) within three seconds. Image credit: DLR.
From the rotation angle and the cyclic phase patterns, we observe that some of the ice floes spin in opposite directions (yellow-orange-red or blue-violet on the rotation angle image) and that smaller ice floes have a tendency to move faster. The areas close to becoming unstable can be identified immediately. This is visible in the left half of the image. Inside the large, stable ice surface, we see a colour pattern that is distinctly different from its surroundings. On the bottom centre left of the image, we can also see an ice floe that is just starting to break off from its larger companion.
The formation flight of TerraSAR-X and TanDEM-X has provided new insights into the dynamics of ice movement in the Arctic regions. An operational use of this new system would allow for a more accurate prediction of ice drift, as well as the seasonal formation and melting of the polar ice caps. This type of ice floe observation could also enhance current techniques for monitoring ocean currents.
Unfortunately, the very short time interval between the measurements has so far made it impossible to create a movement map showing the drift of individual ice floes, A time delay of around 10 to 20 seconds would be needed to achieve this.
Monitoring the movement of the ice floes has been 'frozen' for now. In October 2010, the satellites were moved into a much closer flight formation to accomplish the primary mission objective: the production of a global digital elevation model. Once this mission phase is complete, the distance between the satellites will be increased again so that monitoring of the ice floes can be resumed. Until then, there are still plenty of datasets from the Arctic summer to be analysed.
Tags:
